Coupled Simulations
In order to assess the influence of the projection method on the actual coupled solution, steady aeroelastic simulations were performed with the ACM in conjunction with the flow solvers FLOWer and TAU. Two different configurations were used. The scaled HIRENASD wing with the structural shell model depicted in Fig. 9 is representative for a real-world transport aircraft wing. The flow conditions were chosen according to a test case defined in the project MEGADESIGN [20] for the optimisation of an aircraft cruise configuration. The flight speed is Ma = 0.82 at standard atmospheric conditions in 11 km altitude. These amount to a Reynolds number of Re = 43.2 x 10⁶ and a loading factor of q/E = 0.144 x 10~6. This value is the ratio of the free-stream dynamic pressure and Young’s modulus of the structure and is a dimensionless number that characterises aeroelastic coupling effects. The second test configuration employed is the HIRENASD wing in its original size and the beam structural model displayed in Fig. 11 representing the structure of the actual wind tunnel model. Results are shown here for the conditions of the experimental polar 250 [4]: Ma = 0.80, Re = 23.5 x 10⁶ and q/E = 0.48 x 10~6. In both test cases, the dummy fuselage was not taken into consideration. Identical CFD meshes were scaled to match both configurations. The block-structured mesh for FLOWer is the volume mesh from which the already-presented wetted surface with 31245 points was extracted and has about 2.8 million points. The hybrid – unstructured mesh for TAU has 12.6 million points and a wetted surface with 188983 points. Only results obtained with the FIE and MLS methods are compared.
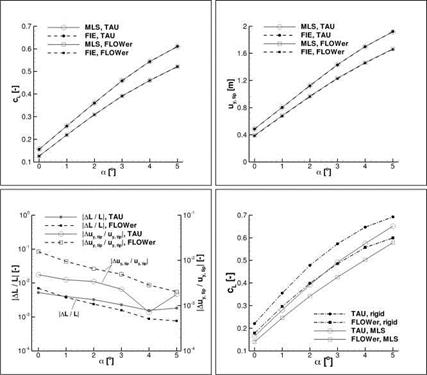
In Fig. 14, the results for the transport aircraft wing configuration are presented. With the MLS method, quadratic interpolation functions were used with nFB = 2 and NM = 67. In the top diagrams, the lift coefficients and the flap-wise bending deflections at the wing tip are plotted over the angle of attack. For both magnitudes the same observation can be made: The projection methods deliver very similar distributions with the same flow solver, but between the results of FLOWer and TAU there is a difference of around 15%. In the bottom left diagram the relative errors in lift and deflection are given. The influence of the projection method is singled out; the deviations between the flow solvers are not shown. The relative error in the tip deflection Auy tip/uy tip| is greater than the values obtained in the previous tests (see Fig. 12). During actual coupled simulations the differences between the projection methods affect the structural load distribution as well as the shape of the deformed
|
Fig. 14 Results of aeroelastic simulations for the scaled HIRENASD wing and the IFL structural shell model at Ma = 0.82, Re = 43.2 x 10⁶, q/E = 0.144 x 10—6 and 0° < a < 5°. Computations were carried out with FLOWer and TAU coupled with the ACM. FIE and MLS were used as projection methods. In all examples the LEA k — о turbulence model and a central differences discretisation in space were applied. top left: Lift polars. top right: Flap – wise tip bending deflections. bottom left: Relative errors in lift coefficients and in bending deflections between the projection methods. The comparisons are only carried out between the distributions obtained with the same flow solver. bottom right: Lift polars disregarding aeroelastic deformation superimposed on those obtained with MLS. In a departure from the previously shown results, these were obtained with the scaled HIRENASD wing with dummy fuselage. |
wetted surface and then feed back to the aerodynamic load distribution of the next coupling iteration. The deviations are still inside engineering limits, though, ranging between one per cent and one per mil. In the bottom right diagram, the lift distributions obtained by "pure” CFD disregarding aeroelastic deformations are additionally provided. Already here the differences are apparent between the flow solvers (These results were obtained for the scaled HIRENASD wing with dummy fuselage, hence the lift coefficients considering aeroelastic deformation are slightly higher than in the top left diagram). In Fig. 15, local pressure distributions at the spanwise
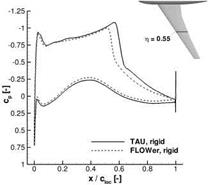
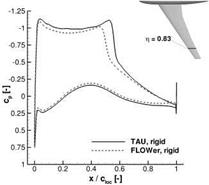
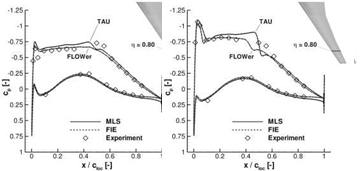
positions n = 0-55 and n = 0-83 are picked out for an angle of attack of a = 3°. In the undeformed configuration TAU predicts a shock position further downstream than FLOWer by about 5% of the local chord length. The higher structural bending moment must then lead to an aeroelastic equilibrium configuration with larger deformations. The differences between the flow solvers are thus aggravated by the aeroelastic coupling. This test case is entirely generic and there are no experimental data that would allow an evaluation of these differences.
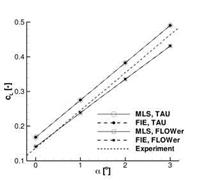
An extensive experimental data base is available for the HIRENASD configuration. Here the same tendencies as with the previous configuration are to be observed, as can be gleaned from Fig. 16. The deformation distributions and the lift polars also coincide well for the projection methods, but there are significant differences between the results of the flow solvers. Measured lift coefficients are superimposed with the simulation results, but do not give a clear direction. Fig. 17 contains calculated and measured pressure distributions for the two highest angles of attack a = 2° and a = 3° at the spanwise stations n = 0-32, n = 0.59 and n = 0-80. The local pressure coefficients by the MLS method and by the FIE method with identical flow solvers coincide excellently, but significant differences between the flow solvers persist. The higher global lift coefficients achieved with TAU are reflected in the higher suction plateaus and shock positions further downstream. For the current test case, predictions with TAU appear in better agreement with the experiments than the FLOWer results, at least at the inboard sections. At n = 0.80 neither solver correctly captures the gradient at the downstream end of the plateau and its height is overestimated using TAU. Admittedly, the presented simulations do not capture the aerodynamic influence of the dummy fuselage on the flow field about the wing.
 |
 |
The differences between the results of FLOWer and TAU are presumably caused by the flow meshes or the numerical parameters used at CATS, and are not related to
Fig. 15 Pressure distributions obtained with FLOWer and TAU without consideration of aeroelastic deformation at two spanwise stations of the scaled HIRENASD wing with dummy fuselage. Inflow conditions are Ma = 0.82, Re = 43.2 x 10⁶ and a = 3°.
 |
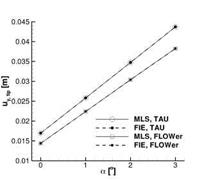 |
Fig. 16 Results of aeroelastic simulations for the HIRENASD wing with a structural beam model at Ma = 0.80, Re = 23.5 x 10⁶, q/E = 0.48 x 10_6 and 0° < a < 3°. left: Lift polars. right: Flap-wise tip bending deflections.
the aeroelastic coupling. Further efforts to narrow down the cause of the differences remain to be made, but are outside the scope of the current paper.
5 Conclusion
In this paper, the spatial coupling methods for reduced structural models in the ACM were examined. The existing method for the projection of loads and deformations between the wetted surface and the structure based on FIE was outlined together with the interpolation schemes additionally required for beam models. The alternative methods MLS and GSB and their implementation in the ACM were explained in detail. For the individual steps of the spatial coupling procedure potential error sources were identified. Several test configurations of increasing complexity were used to investigate the importance of the mesh resolutions of the wetted surface and of the structure on the structural load distribution and the resulting deformation field. Only for thin-walled structural models, a significant influence was detected. It manifests itself as local "bumps” on the structure and, after deformation projection, also on the wetted surface. The projection parameters of the FIE, MLS and GSB methods were investigated; their effect on the shape of the deformed wetted surface was determined with two variants of the HIRENASD configuration with and without dummy fuselage and a structural beam model. With the FIE method, only localised effects were apparent in the vicinity of kinks of the beam axis and intersections between assemblies. Here, additional interpolation schemes assure a smooth and contiguous deformed wetted surface. Otherwise, FIE does not rely on interpolation parameters. With MLS and GSB, interpolations are not acting locally, but the projection as a whole is cast as a spatial interpolation problem. (Yet in practice, local interpolations cannot be foregone completely, as without projection results are
![]()
 |
a = 3.0°
Fig. 17 Measured and computed chordwise pressure distributions for the HIRENASD wing with a structural beam model at Ma = 0.80, Re = 23.5 x 10⁶ and q/E = 0.48 x 10_6.
unsatisfactory in intersection regions between assemblies.) The MLS method exhibited a low overall dependency on the choice of projection parameters. With the GSB method, the shape of the deformed wetted surface was significantly influenced by the position and number of interpolation support points. By means of coupled simulations with the ACM, and either FLOWer or TAU as flow solvers, the practical
applicability of the MLS method was shown. The differences between the lift po- lars, deformation distributions and local pressure distributions obtained with MLS and with FIE and identical flow solvers were small. However, in the results achieved with identical projection methods but different flow solvers, significant differences were apparent. These were linked to the flow solvers, respective the input data used, and not to the aeroelastic coupling procedure. Ongoing work on the spatial coupling in the ACM concerns the extension of the FIE method for volume and shell elements to configurations comprising multiple assemblies.
Acknowledgements. Computing resources were provided by the RWTH Aachen University Center for Computing and Communication and supported by the German Research Foundation under GSC 111 (AICES).


