
Our heavyweight helicopter equal in the world does not have
In Rostov started production of the most load-lifting rotary-wing car The Russian holding «Helicopt[...]

Everything about aircrafts and helicopters. News and events in aviation worldwide. Civil, transportation, military helicopters and airplanes.

Everything about aircrafts and helicopters. News and events in aviation worldwide. Civil, transportation, military helicopters and airplanes.

Everything about aircrafts and helicopters. News and events in aviation worldwide. Civil, transportation, military helicopters and airplanes.

Everything about aircrafts and helicopters. News and events in aviation worldwide. Civil, transportation, military helicopters and airplanes.


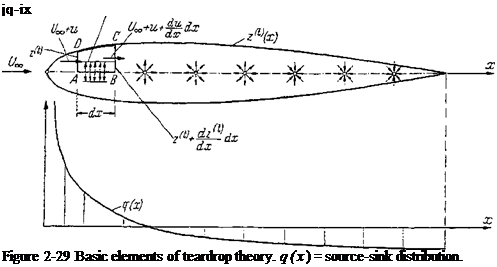
Fundamentals of teardrop theory The term teardrop profile means a symmetric profile of finite thickness. With the method of singularities, a teardrop profile is obtained through superposition of a source-sink distribution along the profile chord with a translational flow (Fig. 2-29). Let a continuous source-sink distribution be given along the profile chord, the source strength per unit length of which is q(x). This source distribution induces the velocity component u{x) in the x direction and produces the velocity component w(x) in the z direction (Fig. 2-29). Let z^(x) be the equation of the upper surface of the teardrop with the coordinate origin on the
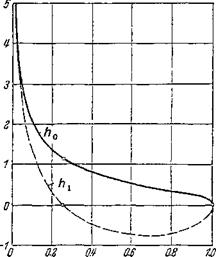 Figure 2-27 The functions h0 and hx for the pressure distribution on the chord at given lift and moment coefficients [Eqs. (2-87) and (2-88) j.
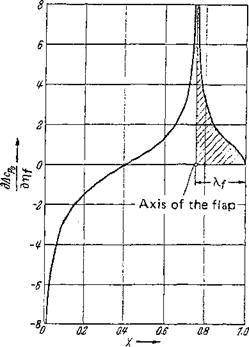
Figure 2-28 Theoretical pressure distribution of the folded plate (flap wing) of Fig. 2-24 at zero lift [Eq. (2-89)]. Chord ratio of flap and wing Лf=cf/c = 0.25.
 leading edge. Then, the relation between source distribution and teardrop shape is obtained easily by applying the continuity equation to the area element ABCD in Fig. 2-29, with the result
{U oo + u) 2^ + -2"?^a;=|^co – f-tt-j – [%№ – j
From this the source distribution in linear approximation is obtained as
= 2^[(t7O0+и)гй] C2-90 a)
 |
= 2 (2-90 b)
For teardrops of moderate thickness, the induced velocities и can be disregarded as compared with £/», with the exception of the vicinity of the stagnation point.
 |
 |
In the case of thin profiles it can be assumed that the velocity components on the teardrop contour are approximately equal to the values on the profile chord. In analogy to Eq. (246), the components of the induced velocity on the chord are obtained as
To obtain a closed profile contour, the total strength of the source-sink distribution must be zero (closure condition):
c
J q(x) dx = 0 (2-92)
.! = 0
In computing the source-sink distribution for a given teardrop shape z^x), the closure condition is automatically fulfilled because of Eq. (2-90).
With the profile chord length c, the dimensionless quantities
y r(r)
X=f and Z<f) = ^ (2-93)
will now be introduced.
The kinematic flow condition, namely, that the profile contour is a streamline, is
dzU) w(x)
dx £7 со
 |
It can be verified immediately that this condition is identical to Eq. (2-90b).
According to Riegels [49], the velocity distribution on the contour is then established by division with


![]() (2-95)
(2-95)
Here, 1/х(х) is called the Riegels factor. Since l/x(x) is zero at the leading edge, it is assured that the velocity goes to zero at the front stagnation point, and the velocity distribution on the contour is finally
![]() T-FC(X) _ 1 / 1 г dZ<l) dX’
T-FC(X) _ 1 / 1 г dZ<l) dX’
t/oo *(Z) + nj dX’ X-X’
In this way, the computation of the velocity distribution for a given teardrop profile has been reduced to a quadrature formula.
By disregarding the Riegels factor, the velocity distribution on a simple biconvex parabola profile becomes
Here, 5 is the thickness ratio t/c. The highest velocity occurs at X = with the value UjniJUoo = (4/я)6. Likewise, the velocity distributions for the extended parabola profiles from Eq. (2-6) can be computed (see Truckenbrodt [49]).
For the evaluation of the quadrature formula, Riegels [49] introduces the Fourier series
Z(0 = sinv 99 X = |(1 + COS99) (2-98)
V ш 1
|
Wc(<p) _ 1 Uoo [8]W) |
in analogy to Eq. (2-85). When this expression for is inserted into Eq. (2-96), the velocity distribution on the contour assumes the simple form
The numerical evaluation of the equation by means of simple quadrature formulas is treated in [49].
From Eq. (242), the contour of the thin symmetric Joukowsky profile* is given by
Z(r) = sin v>(l — cos ф) (2-100a)
= 2e^X(l-X)3 (2-100 b)
where
At 1
£=——4 = 0.775 and xf=4 ЗуТ c f 4
The Fourier coefficients are bt = £, b2 – —ejl, and h3 = b4 = ■ • • = 0. Consequently, the velocity distribution on the contour is given by
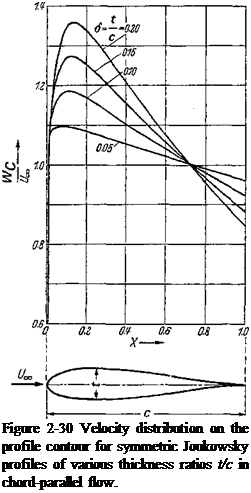
Figure 2-30 shows the velocity distributions computed by Eq. (2-101) for various thickness ratios. Within the accuracy of the plot, complete agreement of the approximate and the exact solutions by conformal mapping is obtained. See Fig.
2- 16 for cL = 0. Because the trailing-edge angle of the Joukowsky profiles is zero, the velocity distribution has no rear stagnation point on the trailing edge.
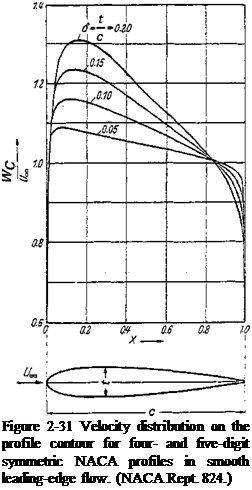
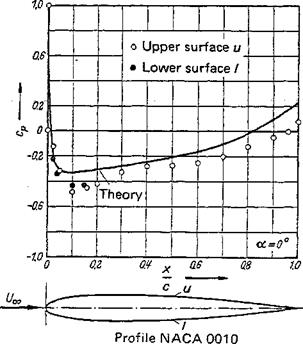
For the four – and five-digit NACA profiles from Fig. 2-2a, the theoretical velocity distributions may be found in [1]. A few distributions at various thickness ratios 5 = t/c are shown in Fig. 2-31. They were computed by the procedure of Theodorsen and Garrick [66]. Values computed by the singularities method deviate only slightly from them. The teardrop shapes of the NACA 6-series, Fig. 2-2c, were established from given velocity distributions, which were determined mainly by the location of the maximum velocity. In Fig. 2-32, the velocity distributions are shown for the four profiles of Fig. 2-33 with a thickness ratio 5 =0.12. Figure 2-33 gives a comparison between theoretical and experimental pressure distributions on the NACA profile NACA 0010 and shows good agreement.
 |
 |
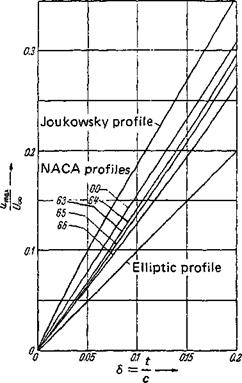
The maximum velocity on a profile is of considerable importance for the
behavior of the profile at high subsonic velocities (critical Mach number. Sec. 4-3-2). In Fig. 2-34, the ratio of the maximum velocity difference to the constant translational velocity is given against the thickness ratio of most of the teardrop profiles discussed above. Accordingly, the maximum velocity depends heavily on the thickness distribution for an otherwise unchanged thickness ratio. The elliptic profile produces the smallest velocity difference, the Joukowsky profile the largest.
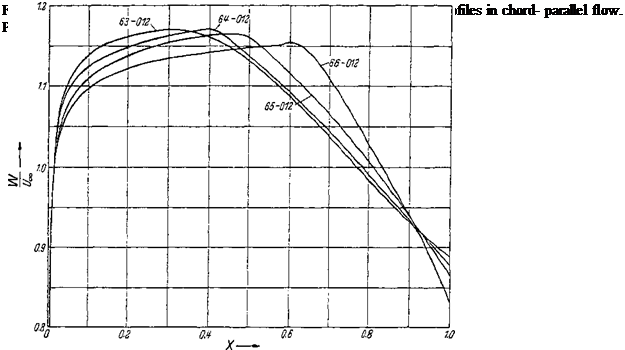 |
Figure 2-33 Comparison of theoretical and experimental pressure distributions for the symmetric profile NACA 0010 in chord – parallel flow.
Figure 2-34 Maximum perturbation velocity wmax of teardrop profiles in chord-parallel flow vs. thickness ratio 5 = t/c.
 Computation of the teardrop profile from a given velocity distribution In analogy to the Birnbaum-Glauert series expansion for the distribution of circulation in the case of skeleton theory [Eq. (2-61)], the source distribution will now be represented in the form of a trigonometric series (see, e. g,, Allen [3] ):
q(<p) = 2 Uoo (b0 tan-— – f Z Вя si™ yj j (2-102)
The relation between x and <p is given in Eq. (2-62). The closure condition for the profile contour, Eq. (2-92), is satisfied when
2B0 +Bi = 0 (2-103)
 |
|
By introducing Eq. (2-102) into Eq. (2-9Ід), the induced velocity in the x direction is obtained as
The profile contour is determined by introducing Eq. (2-102) into Eq. (2-90b) and integrating along X:
The first term represents the Joukowsky profile, as can be verified by comparison with Eq. (2-100). Profile shape and velocity distribution are interrelated by Eq. (2-96), which must now be interpreted as the integral equation for the profile inclination dZ^/dX. Following Betz [4] and Fuchs [16], the solution is
where
denotes the induced velocity distribution on the chord, and % is defined in Eq. (2-95). Since the needed profile inclination is a term of this equation, Eq. (2-106) can be solved only through iterations (see Truckenbrodt [68]). The publications by Eppler [13] and Strand [63] on this subject should also be mentioned.
The simplest case of a constant induced velocity и on the chord leads to an elliptic teardrop profile. For a linear distribution of the induced velocity и/иж,

![]() /- = <5(1 – bX)
/- = <5(1 – bX)
u oo
the profile contour takes the shape
Zw = [4 – 6(1 + 2X)-]VX{1 – X)
For b = 0 the profile is elliptic; for b — f, the Joukowsky profile [Eq. (2-100)] is obtained.


