Tip Vortex Interference
The induced velocity previously derived from the combined momentum and blade element theory can also be obtained using a vortex method as shown in reference 1.13. The method is similar to that used for wing analysis, in which trailing vortices are assumed to leave the wing between adjacent wing elements and to have a strength proportional to the change in lift between the elements. In the simplest rotor vortex theory, the trailing vortices from an infinite number of blades are assumed to form concentric cylindrical vortex sheets with no wake contraction. In practice, the wake does contract producing a local distortion of the induced velocity near the blade tips. Figure 1.31 shows the location of the tip vortices from a finite number of blades with and without wake contraction. It may be seen that the contraction of the wake is such as to make the older vortices force the youngest vortex up toward the rotor plane. As a matter of fact, photographs of the
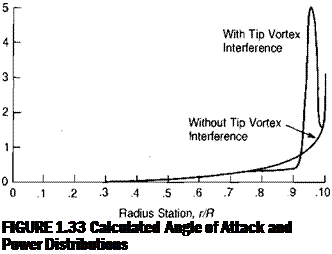
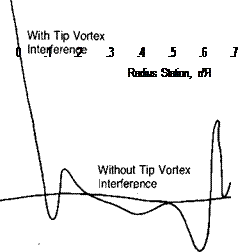
FIGURE 1.31 Tip Vortex Locations with and without Wake Contraction tip vortex made on a humid day at Sikorsky and reproduced in reference 1.14 have shown that in some cases the tip vortex remains in the tip path plane until the next blade actually strikes it, as sketched in Figure 1.32. The changes in the local induced velocity due to the proximity of the vortex cause large discontinuities in the angle of attack distribution, as shown in the top portion of Figure 1.33, which is based on calculations made by a sophisticated computer program as reported in reference 1.5. The lift vectors near the tip have more rearward tilt, and in some cases the tip is stalled compared with the simpler predictions. The distortions affect the distribution of power along the blade, as shown in the bottom portion of Figure 1.33. An attempt to compensate for the high angles of attack near the tip is reported in reference 1.15. It has resulted in the design of a local region of high and nonlinear blade twist on the Sikorsky Blackhawk.
It is to be hoped that a simple and accurate analytical computing method accounting for vortex interference will eventually be developed. In the meantime it is suggested that the momentum method be used with an empirical correction factor. The suggested factor is based on a study of data presented in reference 1.5, which reports on tests of a family of model rotors that had variations in number of blades, twist, blade aspect ratio, and tip speed. The results of this study are summarized in Figure 1.34 as the ratio of the measured power to the power calculated by the momentum method—accounting for variable tip loss factor and
|
FIGURE 1.32 Tip Vortex Interference |
wake rotation—plotted against a parameter that is the product of disc loading and the thrust/solidity coefficient. This parameter has little justification in logic but gives better correlation than either disc loading or Ct/g alone. It does reflect the idea that the wake contraction effect starts as an induced phenomenon that eventually results in stall of local blade elements. Similar results are obtained using the full-scale rotor performance data of reference 1.14. The use of the suggested empirical correction in Figure 1.34 eliminates the number of blades, twist, blade aspect ratio, and tip speed as significant parameters in the vortex interference problem—an assumption that appears to be justified but will warrant continuous review in light of further experience.
The tip vortices are also responsible for another characteristic of hover performance—the relative unsteadiness of the condition. Smoke studies reported in reference 1.5 show that distinct tip vortices can be traced down into the wake only about one radius. At that point, they tend to couple together in a random way, which sometimes reinforces and sometimes cancels the vortex effect. A similar observation reported in reference 1.16 reveals that usually only four well – defined tip vortices can be identified under the reference blade, regardless of the number of blades in the rotor. Figure 1.35 shows Schlieren photographs of the wake of a model rotor in a quiet room. The single exposure shows the third vortex beginning to twist about itself, which soon resulted in self-destruction. Further observation shows that when the vortex does begin to dissipate, the wake ceases to contract and begins to expand instead, as shown in the third photograph of Figure
1.35. The multiple-exposure photograph shows that the vortex paths do not repeat themselves and that at least once during the 15 revolutions a very significant transient excursion occurred. This type of randomness manifests itself as unsteadiness in the inflow at the rotor disc and in both measured thrust and power.

![]()
 |
CD
$
О
0.
■О
CD
N
«
Е
о
Z
Source: Clark, “Can Helicopter Rotors Be Designed for Low Noise and High Performance?" AHS 30th Forum, 1974.
Figure 1.36 presents a 14-second record of the thrust and power variations of the AH-56A rotor on the Lockheed whirl tower. The variations amount to approximately ±3% for thrust and ±6% for power. This type of variation makes hover performance difficult to measure accurately and probably accounts for much of the test scatter in Figure 1.34. Yet another illustration of the nonsteadiness of hover is given by reference 1.14, where it is shown that even on a whirl tower in
|
4.5-foot Dia. Model
|
|
FIGURE 1.34 Error Due to Tip Vortex Interference |
Source: Data from Landgrebe, “An Analytical and Experimental Investigation of Helicopter Rotor Hover Performance and Wake Geometry Characteristics,” USAAMRDL TR 71-24, 1971; and Jenney, Olson, & Landgrebe, “A Reassessment of Rotor Hovering Performance Prediction Methods," JAHS 13-2, 1968.
winds of less than 5 knots, the vortex interaction occurs over only one-quarter to one-half of each revolution.


