In-Situ Calibration Uncertainty
7.3.1. Experiments
As pointed out before, the use of a priori PSP calibration in large wind tunnels often leads to a considerable systematic error since the surface temperature distribution is not known and the illumination change on a surface due to model deformation cannot be corrected by the image registration technique. The systematic error is also related to uncontrollable environmental testing factors. Therefore, in actual PSP measurements, experimental aerodynamicists are forced to calibrate PSP in situ by fitting (or correlating) the luminescent intensity to pressure tap data at a number of suitably distributed locations. In a sense, in-situ PSP calibration eliminates the systematic error associated with the temperature effect and the illumination change by absorbing it into an overall fitting error.
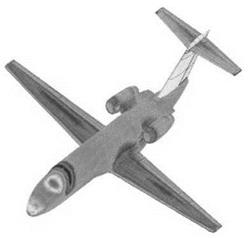
Kammeyer et al. (2002a, 2002b) assessed the accuracy of the Boeing production PSP system by statistical analysis of comparison between PSP and pressure transducers over a large numbers of data points. The Boeing PSP system is a typical intensity-based system that uses eight CCD (1024×1024 or 512×512) cameras for imaging, thirty lamps for illumination, and two IR cameras measuring the surface temperature for correcting the temperature effect of PSP. The test article was a 1/12th-scale model of a Cessna Citation that was instrumented with a total of 225 pressure taps. The tests were conducted in the DNW/NLR HST wind tunnel, a variable-density, closed circuit, continuous tunnel with slotted top and bottom test section walls (12% open). The test section was 6.56 ft wide and was configured to be 5.25 ft high. The cameras and lamps were mounted in the floor and ceiling. A run consisted of a lift polar at each of several Mach numbers from 0.22 to 0.82. Two Reynolds numbers, 4.5 and 8.3 millions, were run. Fourteen angles of attack were from -4 to 10o. Over 8300 visual images and over 2000 IR images were obtained for 676 test points. The wind-off reference images were acquired after the run when the fan had stopped in order to reduce the effect of the model temperature distribution. Figure 7.11 shows a typical pressure distribution on the model obtained by PSP.
|
Fig. 7.11. Typical pressure distribution obtained from PSP on a Cessna Citation model. From Kammeyer et al. (2002a) |
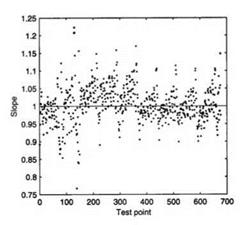
In-situ PSP calibrations were performed by utilizing 78 of 225 pressure taps for each of the cameras. Figure 7.12 shows the variation of the in-situ calibration slope (i. e. the Stern-Volmer coefficient B) as a function of test point throughout the tests, where no temperature correction was applied. The variation does not show an overall trend; the repeating pattern mirrors the pattern of the test conditions, wherein sequential angles of attack were run for sequentially increasing Mach numbers. The mean value of the slope is close to one, which is approximately consistent with the paint characteristics given by a priori calibration. The scatter is attributed to a number of factors, including the nonhomogeneous temperature distributions, temperature differences between the wind-off and wind-on conditions, lamp intensity drift, and image registration error.
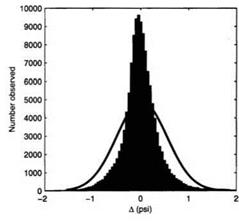
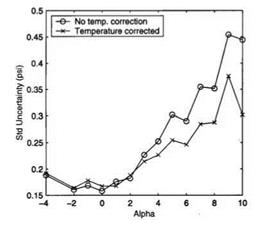
The accuracy of the PSP system was directly assessed by comparing the pressure value measured by a transducer/tap combination with that obtained from PSP at the same tap location. After some problematic pressure data were excluded, 130,391 comparisons from 221 taps and 676 wind-on test points were used as an overall set of realizations for statistical analysis. The PSP data processing included in-situ calibration, but did not exercise the explicit temperature correction. When examining the comparisons, the 78 taps were used for in-situ calibration to provide residual comparisons, while other taps provided truly independent comparisons. Figure 7.13 shows a histogram for the over set of comparisons, where a Gaussian distribution with the same mean and standard deviation is superimposed for comparison. Clearly, the distribution is nonGaussian. A robust estimate of the 68% confidence level gives an estimate of the standard uncertainty of 0.29 psi, which corresponds to 0.0065 in Cp. Figure 7.14 shows the standard uncertainty as a function of the angle of attack for the right wing. The behavior of the dependency of the uncertainty on the angle of attack corresponds to wing deformation. This indicates that the error is associated with the movement of the model in the non-homogenous illumination field, which cannot be corrected by the image registration technique. Kammeyer et al. (2002a, 2002b) also studied temperature correction using the IR cameras. Two sets of PSP data obtained before and after temperature correction were used to assess the effectiveness of the temperature correction. Figure 7.14 shows the standard uncertainty after the temperature correction as a function of the angle of attack. The temperature correction was increasingly effective when the angle of attack was larger than 2o; it removed the spatial biases associated with the temperature distribution on the model. Overall, the standard uncertainty, priori to the temperature correction, was in the range 0.16-0.45 psi (0.04-0.1 Cp); with the temperature correction, it was in the range 0.17-0.35 psi (0.04-0.09Cp). The significance of the work of Kammeyer et al. (2002a, 2002b) is that it identifies the functional dependency of in-situ PSP calibration uncertainty on the testing parameters such as the angle of attack and Mach number.
|
Fig. 7.12. Variation of PSP in-situ calibration slope throughout the tests on a Cessna Citation model. From Kammeyer et al. (2002a) |
|
Fig. 7.13. Histogram of the overall set of PSP errors compared with a Gaussian distribution of the equivalent mean and standard deviation. From Kammeyer et al. (2002a) |
|
Fig. 7.14. Standard uncertainty of PSP on the right wing of a Cessna Citation model as a function of the angle of attack. From Kammeyer et al. (2002a) |


