INFLUENCE OF WING AND HORIZONTAL STABILIZER ON VERTICAL TAIL
In conventional airplane design, the horizontal tail surface is more or less closely combined with the vertical surface. The interaction between them, and influence of the wing upon the vertical tail are covered in this section.
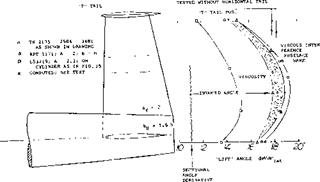
Sidewash. Consider the configuration at the bottom of figure 13, where the wing is located at the lower side of the fuselage. The flow around the lower side when operating at an angle of yaw is reduced, while flow over the upper side is increased. A rotation, or circulation of the flow, is thus produced, about the longitudinal axis of the fuselage. At the vertical tail surface location above the fuselage the flow over the top represents a certain side- wash and it combines with the lateral velocity component due to sideslipping. In the case of a low-wing configuration, this type of sidewash is stabilizing. Sidewash angles (*) at the location of the vertical tail surface, where directly measured (10 ,d) for the “shortest” among the configurations are illustrated in figure 11. Without a horizontal surface present, average angles were found to be as follows: configur – di /d/і (d6 jd/s ) type of flow dC^/ /d^s ratio ation
high wing – 0.040 – 0.40 reduced side flow 0.030 0.64
no wing + 0.360 0 basic cross flow 0.047 LOO
low wing + 0.640 + 0.28 increased flow 0.057 1.21
|
HIGH WING WITH z = 0.20 cx a) WINDMILLING:
|
RATIOS OF VERTICAL TAIL CONTRIBUTION ARE: HW/LW -0.1, or
LW/HW = 1.4
NOTE: FIRST VALUES ARE WITH TAIL, SECOND VALUES WITHOUT.
LOW WING IS MUCH MORE STABLE THAN HIGH WING.
POWER INCREASES SIDEViASH AND STABILITY IN LOW WING.
Figure 13. One and the same type of airplane configuration tested (21,g, h) in low-wing as well as in high-wing arrangement.
 For example in the LW configuration, the local angle of sideslip is (1 + 0.64)^ ; and the ratio is 1.64/1.36 = 1.2. The force derivatives vary roughly in proportion to those of the flow angle (/$ + 6 ). In form of an equation, therefore, the lateral force in the vertical tail corresponds to
dC^/d^ =0 + 4(dA /d^HdC^/d^ (17)
where (o) indicates the force derivative of the tail on fhselage, but in the absence of a wing. The difference between LW and HW is appreciable.
Horizontal Tail Interference. Results of a wind-tunnel investigation (13 ,f, g) on the interference of horizontal tails are presented in figure 12. In comparison to the lateral tail-force derivative without the wing, ratios are as follows:
|
configuration |
w’out H’tail |
ratio |
with H’tail |
ratio |
|
|
high wing |
0.75 (0.65) |
0.70 |
0.83 |
(0.82) |
0.82 |
|
mid wing |
1.00 (1.00) |
1.00 |
0.98 |
(0.99) |
1.00 |
|
low wing |
1.16 (1.15) |
1.16 |
1.07 |
(1.06) |
1.07 |
The ratios found are confirmed by results listed in parentheses as quoted from (12,d). In comparison to low-wing conditions explained above, all high-wing configurations are lower in directional stability. In the presence of the horizontal tail, the variations due to wing position are ggnerally less than without that surface. The rotation or circulation of the flow field discussed above, is evidently reduced when adding a pair of horizontal “fins” to the fuselage.
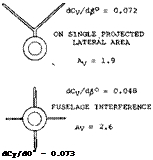
End-Plate Effect. A horizontal tail surface added to a vertical fin, would be expected to have the same effect as an end plate attached to a wing tip. For an average horizontal tad which may have a span twice the height of the vertical tail surface the effective aspect ratio of the surface is theoretically increased to = 1.8 A as indicated in Chapter III. Based on equation (14) the lateral force derivative dC^ /d^ of the tail assembly would then be increased from 0.026 to 0.042 for A^ = 1, or from 0.045 to 0.063 for A^ = 2, for example ratio’s of 1.6 and 1.4 respectively.
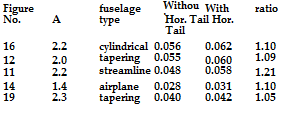
Fuselage Wake. Experimental values for dC/d^ , showing the influence of the horizontal upon the vertical tail, are as follows:
dCju/d/3
It is evident from these statistics that the large improvement indicated by theory, resulting in a ratio around 1.5 (as discussed above) are not obtained in configurations where the horizontal tail is attached to the fuselage. It must be assumed that the wake (boundary layer) developing along the fuselage disrupts the lifting line or the trailing vortex sheet originating from the tail assembly eliminating the predicted and plate effect.
![]()
![]()
![]()
![]()
Influence of Canopy. The experimental results discussed so far, regarding cross flow and sidewash at the vertical tail, apply to perfectly smooth and plain wind tunnel models. Test results for the complete airplane configuration shown in figure 13, tested with the wing in low as well as in high position show:
a) Without the vertical tail, lateral forces and yaw moments are essentially the same for both wing positions.
b) With the tail on, its contribution to both force and moment is larger for the low-wing configuration.
The ratios of the due to tail derivatives, LW/HW ^ 1.4, or HW/LW ^ 0.7, are in the same order of magnitude as those which can be obtained above. [121]
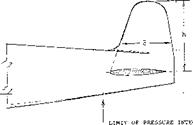
Figure 14. Distribution of lateral or normal force (load) in vertical surface and fuselage tail end of a fighter-type airplane configuration (9,g).
![]()
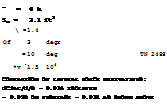
 The Load Distribution over the vertical surface of a conventional airplane configuration, is plotted in figure 14. While the load in the tail end of the fuselage is practically zero without surfaces attached, a small lateral force is induced when adding the vertical fin. The force in the tail of the fuselage is further increased when adding the horizontal surface (preferably in the lowest possible position). However, the lateral force in the vertical surface is very much reduced as against the theoretically expected load. In fact, when attached to the fuselage, the force derivative of the fin in figure 14 is smaller than in free flow.
dC^/d^ = 0.039 in free flow (estimated)
= 0.023 when attached to fuselage = 0.027 with horizontal tail as shown
To explain this result obtained at a reasonably large Reynolds number the original report (9,g) stated “large losses in dynamic pressure resulting from the wakes of the canopy and wing-fuselage juncture, were found to occur in the vicinity of the vertical tail”.
It can also be said that the vertical tail, having an exposed area ratio S^/S between 5 and 6% only, is too small and not high enough.
|
|
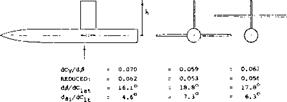
AR RATIO = 1.8 = 1.2 = 1.4
"REDUCED" MEANS THAT THE RESULTS AS TESTED AT M = 0.5 KERE REDUCED TO M O, BY DIVIDING BY FACTOR OF 1.1.
THE LATERAL FORCE ANGLE CORRESPONDING TO 0.062 (FOR EXAMPLE)
IS d^/dClat = 16.1°, WHERE 16.1 – 11.5 = 4.6° REPRESENTS THE INDUCED ANGLE.
FOR COMPARISON, THE LIFT-CURVE SLOPE OF AN ISOLATED RECTANGULAR SURFACE WITH A = 2.2 IS delat/d4 = 0.050.
AR RATIO MEANS (EFFECTIVE/GEOMETRIC) ASPECT RATIO.
NOTE: c = 0.5 ft CHORD OF 64A0.0
h = 1.1 ft – FROM FUSELAGE AXIS
S = c h ft: = REFERENCE AREA
Rc = 1.6 (10) = REYNOLDS NUMBER
NACA RM L53J19
Figure 15. Effectiveness of a vertical tail surface (fin) tested (6,b) on a cylindrical “fuselage”.
Horizontal Tail Position. In all examples listed above, the horizontal tail increases the effectiveness of the vertical surface by approximately 10%. From the available experimental results plotted in figure 16 the vertical position of the horizontal surface on the vertical fin changes the lateral force derivative as follows:
a) The horizontal surface at 1/2 the height of the vertical tail reduces the effectiveness.
b) maximum derivatives are obtained with the horizontal on top of the vertical tail
‘T” Tail In uppermost position, the horizontal surface forms a “T” together with the vertical fin. As explained in (15,e), advantages of the “T” tail are as follows:
a) the stabilizing effectiveness of the vertical tail is increased.
b) the horizontal tail is removed from the field of maximum downwash and the irregularities of the propeller slipstream (if there is one).
c) lateral tail effectiveness is preserved to highest angles of attack.
A “T” tail is also included in figure 17. Another “bold” configuration is shown in figure 18. In all examples tested, the experimental values obtained, remain somewhat below the theoretically expected lateral force derivatives.
|
Figure 16. Effectiveness of vertical tail surfaces, as a function of the vertical position at which the horizontal surface is attached. |
of = о TO 10° Rv = 5(10)5 £5A006
|
|
dCv/d£° = 0.026 EACH
|
VERY INEFFECTIVE
|
MOST EFFECTIVE
Figure 17. Lateral force derivative developing in the tail configuration shown (6,a).
![]()
(15) Characteristics of “T” tails:
a) Sleeman, Auxiliary Surfaces, NASA D-804 (1961).
b) Goodson, “T” Tail and Double Tail, NASA D-950 (1961).
e) Multhopp, “T” Tails, Aero Digest May 1955.
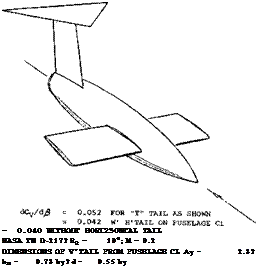
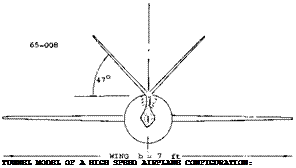
Figure 18. Lateral force characteristics of a vertical tail surface (I6,b) for three different arrangements of the horizontal surface, including that of a *T” tail.
“V” Tail The lifting characteristics of dihedraled wings are presented in Chapter III. The neutral force in each panel of a combined horizontal plus vertical tail assembly as in figure 19, approximately corresponds to
dC/v/do^7?=(dC^ /doC)a
where “o” indicates the lift curve slope for the dihedral angle Г – 0. When exposing the “V” tail to an angle of yaw, the angle of attack normal to the panels changes as
oCn — sin^e sin Г
The lateral component of the neutral forces (Fу = N sin Г ) thus corresponds to
dC^. Ids = (dC^ /doc)o sinzT
This mechanism is easily understood for zero lift (where the angle of attack is zero). When at an angle of yaw, one side (one panel) then assumes a positive and the other one a negative normal force. Disregarding a rolling moment, the resultant is the lateral force indicated in the last equation.
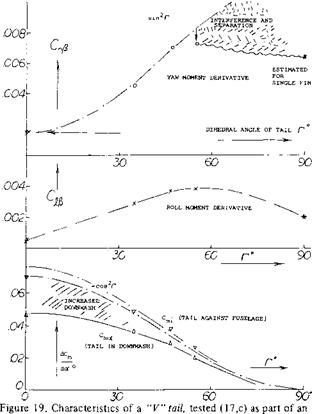
“V” Derivatives. Experimental results of a “V” tail tested alone (without a fuselage) are presented in Chapter XI. Lateral and longitudinal characteristics of a single-engine airplane model using a variable “V” tail are reported in (17,c). Figure 19 shows configuration and derivatives as tested. It should be noted in particular:
1) that interference and flow separation starts above Г = 45°,
2) that the tail panels move up and into reduced down – wash, as the dihedral angle is increased,
3) that a roll moment due to yaw is obtained, similar to that in a dihedraled wing.
The particular “V” tail tested, is mounted on top of a dorsal “trunk”. The apex point of the tail is thus raised above the fuselage wake. The dorsal part also adds to lateral surface area. As a result, the lateral force derivative is some 30% larger than according to basic “V” tail theory (see Chapter III).
|
s = |
8.1 |
ft2 |
A1RATIO OF TAIL = |
5, FOLDED DOWN |
|
5 = |
1.2 |
ft |
||
|
st = |
.41 |
S |
TO HINGE LINE OF 1 |
"ELERUDDER" |
|
Л = |
.53 |
b, |
SHOULD BE 0.47 b, |
EFFECTIVE |
|
NACA TN 1478 (18,c) DERIVATIVES IN THE GRAPHS REPRESENT THE TAIL CONTRIBUTIONS |
|
airplane configuration. |

![]()
![]()
![]()
![]() Area Required. A dihedral angle of 30s provides a ratio between vertical and horizontal tail performance that is comparable to conventional tail assemblies. The linear dimensions (chord end projected horizontal span) of the “V” tail should then be l/cos30° = 1.16 times those of the equivalent conventional horizontal tail. The total surface area required, is roughly the same. Therefore, if drag is to be reduced by using a “V” tail, this can only be expected on the basis of reduced interference (only 2 panels joining the fuselage, instead of the conventional 3). It must also be taken into consideration that the combination of two different control surfaces in one unit, may pose some problems in design, construction and operation.
Area Required. A dihedral angle of 30s provides a ratio between vertical and horizontal tail performance that is comparable to conventional tail assemblies. The linear dimensions (chord end projected horizontal span) of the “V” tail should then be l/cos30° = 1.16 times those of the equivalent conventional horizontal tail. The total surface area required, is roughly the same. Therefore, if drag is to be reduced by using a “V” tail, this can only be expected on the basis of reduced interference (only 2 panels joining the fuselage, instead of the conventional 3). It must also be taken into consideration that the combination of two different control surfaces in one unit, may pose some problems in design, construction and operation.
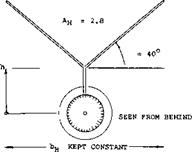
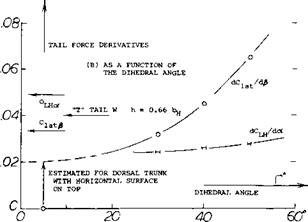
“Y” Tail To avoid any fuselage interference of the “viscous’" type described above, the “V” tail can be moved up in the manner as shown in figure 20, thus forming a “Y”, together with the added vertical stub (19). Since in the tail family tested, the horizontal span b^ is kept constant, we have referred all coefficients to the area (cbK ). Of course, the stub must be expected to contribute some lateral force of its own.
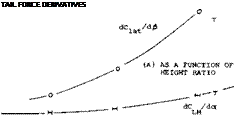
Graph (A) indicates how the derivative dC^. /d # increases with the height ratio of the vertical part of the configuration. As the tail surfaces are raised more and more, something similar to a “T” tail is obtained; and the “Y” tail is thus realized to be a crossbreed between “V” and “T”. When increasing the dihedral angle of the tail in figure 20, keeping the span b^ constant, the lateral force derivative increases in the manner as shown in Graph (B).
Pitching Moment. Consideration of “V” or “Y” tails is not complete without some account of their longitudinal contribution. Pitching moments of the tail configurations in figure 20, were measured behind a wing with the same aspect ratio and twice the linear dimensions of the horizontal tail projection. Using the tail volume = 0.25/0.6 = 0.42, the derivatives dC^ /dal were obtained as plotted in the graphs. The lifting or pitching effectiveness of the tail:
increases when raising the tail assembly out of fuselage
wake and wing down wash,
increases slightly when making the dihedral angle larger, while keeping hH constant.
(16) Characteristics of unusual tail configurations:
a) Sleeman, Tail Configurations, NACA RM L57C08.
b) Fournier, “Exotic” Configurations, NASA D-217 (1960).
c) See “V” tails in (18) and “T” tails in (16)..
d) Sleeman (see a), “Y” Tails, NACA RM L56A06a. [122]
For comparison, we have also put a pair of points into the two graphs, representing a “T” tail having the same height and span as the “Y” tail in figure 21. The lateral and longitudinal effectiveness of the “T” tail is equal to the best “Y” tails. In final analysis, the roll moments due to vertical tails when at an angle of yaw also must be considered, Chapter XIII.
|
|
|
(NOT, |
SHOWN) : |
TESTED AT: |
|
10.4 |
INCH |
O’ = ZERO |
|
3.6 |
INCH |
M = 0.6 |
|
6.0 |
INCH |
Rc = 5 10; |
|
|
006
004 002-
WbH
06
|
Figure 20. Stability characteristics of a “Y” shaped tail assembly (16,d): (A) as a function of vertical location (length of dorsal piece), (B) as a function of the angle of dihedral. I (18) In the configuration as in figure 21, there is little “viscous” fuselage interference. When used in connection with the tail end of a conventional fuselage, wake interference would be similar to that in figures 13 and 14. |
(19) Ribner, Propellers in Yaw, NACA Rpt 819 & 820 (1945).


