Simulation
Inspired by the experimental study of Kammeyer et al. (2002a, 2002b), Liu and Sullivan (2003) studied in-situ calibration uncertainty of PSP through a simulation of PSP measurements in subsonic Joukowsky airfoil flows. It is assumed that in – situ calibration uncertainty is mainly attributed to the temperature effect of PSP and illumination change on a surface due to model deformation. The Joukowsky airfoil and subsonic flows around it are generated using the Joukowsky transform plus the Karman-Tsien rule as described in Section 7.2. An adiabatic model is
considered that is coated with Bath Ruth + silica-gel in GE RTV 118. Four point light sources for illuminating PSP and two cameras for imaging are placed at the same locations as described in Section 7.2. The twist 0twist and bending Ty of the airfoil are a function of the angle of attack (AoA or a) for a given Mach number and Reynolds number. Based on previous wing deformation measurements (Burner and Liu 2001), the typical linear relations 0twist =-0.113 a (deg) and Ty = 0.022a (in) are used over a certain range of AoA at a certain spanwise
location of a wing. Thus, a change of the illumination radiance on the airfoil surface due to the deformation is estimated using a transformation of rotation and translation for the airfoil moving in the given illumination field.
In simulation, the measured luminescent intensity (I) distribution of PSP in the wind-on case (deformation case) is generated by
where Iref0 and Iref are the reference luminescent intensities (without wind) on the non-deformed airfoil and deformed airfoil, respectively. It is assumed that Iref0 and Iref are proportional to the corresponding illumination radiance levels
L0 and L on the non-deformed airfoil and deformed airfoil, respectively. The surface temperature T is substituted by the adiabatic wall temperature distribution Taw, and the pressure distribution is given by the Joukowsky transform plus the Karman-Tsien rule for subsonic flows. Therefore, the resulting luminescent intensity distribution contains the effects of both the illumination change and temperature variation on the surface.
Assuming that the wind-on image (I) is already re-aligned with the wind-off image Iref0 on the non-deformed airfoil by the image registration technique, in-
situ PSP calibration is made to correlate Iref0/I to p/pref using the Stern-
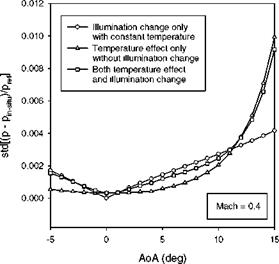
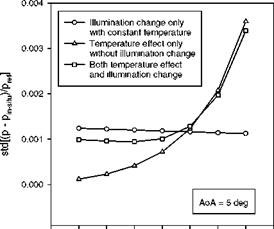
Volmer relation based on 104 virtual pressure taps on each of the upper and lower surfaces. For a given AoA and Mach number, the histogram of in-situ calibration error Ap/ pref = (p – pin_!dtu)/pref is found to be a near-Gaussian distribution, where Ap is a difference between the true pressure from the theoretical distribution and the pressure converted from the luminescent intensity using in – situ calibration. The standard deviation (std) of the probability density function is dependent on AoA and Mach number. Figures 7.15 and 7.16 show the std of the in-situ calibration error as a function of AoA for Mach 0.4 and as a function of the Mach number for AoA = 5o, respectively. Figures 7.15 and 7.16 also show the isolated effects of the temperature and illumination change on the std. The behavior of the calculated std as a function of AoA is very similar to the experimental results shown in Fig. 7.14. The concavity of the std as a function of AOA in Fig. 7.15 is mainly attributed to the movement of the airfoil.
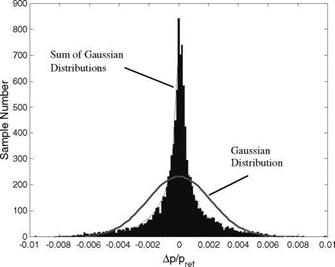
Figure 7.17 shows the simulated histogram for an overall sample set of Ap/pref (a total of 10920 samples) over the whole range of AoA and Mach
numbers, duplicating the experimental non-Gaussian distribution in Fig. 7.13 given by Kammeyer et al. (2002a, 2002b). The Gaussian distribution with the same std is also plotted in Fig. 7.17 as a reference. In fact, for a union of sample sets having near-Gaussian distributions with different the std values at different AoA and Mach numbers, the distribution becomes non-Gaussian because more and more samples accumulate near zero when forming a union of the sample sets. The probability density function of a union of the N sample sets should be given by a sum of the Gaussian distributions rather than the Gaussian distribution, i. e.,
N
N~1 ^ exp(-x2 /2a2 )/^2nai.
i=1
As shown in Fig. 7.17, this distribution correctly describes the simulated histogram. Note that we should not confuse this case with the central limit theorem that deals with a sum of independent random variables. Although the simulation is made for an airfoil section of a wing, the in-situ calibration error for a wing can be estimated by averaging the local results over the full wingspan; therefore, the behavior of the error for a wing should be similar to that for an airfoil.
|
Fig. 7.15. In-situ PSP calibration error as a function of the angle-of-attack (AoA) for Mach 0.4 in Joukowsky airfoil flows. From Liu and Sullivan (2003) |
|
0.25 0.30 0.35 0.40 0.45 0.50 0.55 0.60 0.65 |
Mach Number
Fig. 7.16. In-situ PSP calibration error as a function of the Mach number for AoA = 5o in Joukowsky airfoil flows. From Liu and Sullivan (2003)
|
Fig. 7.17. Histogram of the overall set of in-situ PSP calibration errors in the whole ranges of AoA and Mach numbers in Joukowsky airfoil flows. From Liu and Sullivan (2003) |


