Swept wings in transonic flow
4.8 In aircraft applications, the term "transonic" is used in at least two different meanings. Firstly, and probably in its stricter sense, transonic flows are those where the freestream Mach number is near unity, either just below or just above the speed of sound. Mathematically, this flow is governed by a parabolic differential equation and, if the perturbations are small, the velocity is then near-sonic everywhere in the flowfield. Secondly, the term transonic is used more loosely when the flow over some body is of the mixed type, for instance, when a local supersonic region is embedded in an otherwise subsonic flow. This flow is described by differential equations which change from the elliptic to the hyperbolic type.
It is somewhat confusing that theories derived for the first case are sometimes used for the second.
We are concerned here with both types of flow: as explained in Section 4.2, swept-winged aircraft may, in principle, fly at transonic speeds (see Fig.4.9); and, if we think in terms of infinite sheared wings as discussed in Section
4.2, mixed flows may occur when the Mach number component normal to the isobars exceeds unity, at low as well as at transonic and supersonic mainstream Mach numbers (see Figs. 4.7 and 4.8). In fact, an extensive local region of supersonic flew may bring considerable practical advantages. This means that we have before us many different types of flow which are more complicated than any discussed so far and this, in turn, makes it imperative to adopt a strictly
Since the main effect of a fence is the change of pressures due to reflection, the often-used term "boundary-layer fence" is inappropriate and its implications are misleading.
pragmatic and utilitarian attitude and to concern ourselves only with those flows which may offer useful engineering applications. Therefore, after a brief survey of possible flows, we shall try to select those with practical significance and then address ourselves to the problems we think really matter and see how far these can be solved.
There is a vast literature on the gasdynamics of transonic flows, and we refer here to some books and papers which may usefully be consulted: J Ackeret (1927), A Busemann (1931), L Howarth (Ed) (1953), W R Sears (Ed) (1955), К Oswatitsch
(1956) , К G Guderley (1957), H W Liepmann & A Roshko (1957), H Schlichting &
E Truckenbrodt (1959), К Oswatitsch (Ed) (1962) and (1975), P Germain (1964),
I Teipel (1964), M van Dyke (1964), H Ashley & M Landahl (1965), J Zierep
(1966) , J D Cole (1968), M Sichel (1968), C Ferrari & F G Tricomi (1962),
AGARD (1968), D KUchemann (1969), E Leiter & J Zierep (1971), F W Riegels &
F Thomas (1973), F Bauer et at. (1972), H Yoshihara (1972), F R Bailey (1973), and M G Hall (1975) where further references may be found.
 |
 |
(a) (b) (c) (d)
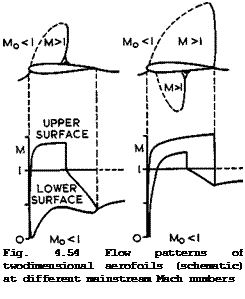
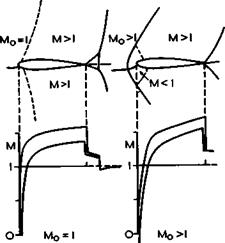
It is convenient to distinguish first between various flows which may typically occur on a twodimensional lifting aerofoil at a given attitude as the mainstream Mach number is increased from a subsonic to a supersonic value, when we also assume that large-scale flow separations can be avoided. Such a series of flow patterns is sketched in Fig. 4.54. .The transonic flow (in the second definition) begins when the highest local Mach number reaches unity, and thus we may regard the flow in Fig. 4.38 (a) as one of the series, except that the lift is higher and the mainstream Mach number low. J Osborne & H H Pearcey (1971) have shown that a small supersonic region may exist near the leading edge even under these conditions and that it exhibits the essential features discussed here. For example, a suction coefficient lower than about – 15 indicates local supersonic flow at Mq = 0.2, according to (4.29), and this is frequently encountered, even though the supersonic region, like the short bubble in Fig. 4.40, is not easy to detect because of its small size.
Thus we may expect these types of flow all along the flight envelope, from the stall to cruising conditions.
The sketches in Fig. 4.54 give the aerofoil shape, with shockwaves indicated as full lines, and also sonic lines (along which the local Mach number is unity) indicated as dashed lines, together with the distribution of the local Mach number along both surfaces of the aerofoil. The flow pattern in Fig. 4.54 (a) incorporates a local region of supersonic flow on the upper surface, terminated by a shockwave, in an otherwise subsonic flow. A subsonic compression over the rear of the upper surface brings the pressure to a value slightly above the undisturbed mainstream pressure. At the higher, but still subsonic, mainstream Mach number in Fig. 4.54 (b), the supersonic region is assumed to extend over the whole of the upper surface and to be terminated by a shockwave located at the trailing edge, which provides the whole pressure rise that is needed. There may now be a supersonic region also on the lower surface, but this may end upstream of the trailing edge, i. e. the two shockwaves will be at the same chordwise position only in exceptional circumstances. Fig.
4.54 (c) gives the conventional representation of a nominally sonic mainstream (in the view of small perturbation theory: the flow cannot strictly remain sonic up to the sonic lines, as shown, there must be strong retardation in the flow near the attachment line), when the flow is supersonic over both surfaces. This is the transonic flow in the first, strict, sense defined above. This flow pattern is then assumed to remain substantially the same at freestream
Mach numbers slightly below and slightly above unity (sonic freeze), with a
detached shockwave appearing far ahead of the aerofoil when Mq > 1. The compression in the region of the trailing edge is shown somewhat more realistically than in small-perturbation theory, which would assume only one weak shockwave at the trailing edge, nearly normal to the mainstream. Instead,
there may be two oblique shocks at the trailing edge, followed by a normal
shock in the wake. The last flow pattern in Fig. 4.54 (d) assumes a supersonic mainstream. Because of the non-zero thickness of the aerofoil and the rounded nose, the flow differs from that of a thin lifting plate in Fig. 3.7 in that there is a detached shockwave standing off the leading edge, with an embedded local subsonic region behind it, and in that there are two shockwaves at the trailing edge. This flow is regarded here as "supersonic", but it is difficult to define precisely where the "transonic" flow regime has ended. It is sometimes suggested that the transonic range ends when the lowest local Mach number reaches unity everywhere, but this will never happen near the leading edge of the round-nosed aerofoils considered here.
It cannot be assumed that the flow changes smoothly from one pattern to another as the mainstream Mach number is changed. Some of the flows are quite unrealistic in this sense and cannot be reached smoothly from neighbouring conditions, e. g. from lower values of Mq or a, because of flow separations. This will have to be discussed in more detail below. We also note that the different distributions of the local Mach number along the aerofoil imply large, and possibly unacceptable, changes in the loadings and hence in lift, drag, and pitching moment. Increasing the Mach number from low-subsonic values, we can expect that the lift at a given angle of incidence will increase at least according to the Prandtl-Glauert rule,
![]() (4.129)
(4.129)
(see Section 2.3), and that it will fall again when Mq > 1 roughly accor
ding to the Ackeret rule
![]()
![]()
![]()
![]() (4.130)
(4.130)
 |
by (3.48). In between, near Mg = 1, CjVa can be expected to behave rather erratically. Very roughly, the variations with Mg of lift and drag on an aerofoil at a fixed angle of incidence are like those shown in Fig. 4.55. When
о
the critical Mach number is exceeded, the extra lift generated by the local supersonic region in a flow like case (a) in Fig. 4.54 should make C^/a greater than that given by (4.129), at a cost in drag due to the entropy increase in the air passing through the shockwave (if the flow remains attached), which may be relatively small. This flow (a) may also be steady. The lift then drops with increasing Mach number, in cases (b) and (c), and it may approach the Ackeret value from below at a low-supersonic mainstream Mach number in case (d). The drag must be expected to be high in all these cases.
Of all the flows in Fig. 4.54, that in case (a) shows the greatest promise of practical usefulness. This should be the flow to realise the advantages indicated by curve (c) in Fig. 4.8, and tb& is the type of flow we want to discuss further. We must remember from now on that the trailing edge will always be "subsonic", that is to say, the component Mach number normal to the trailing edge will be subsonic. If the flow remains attached and the wake thin and slightly curved upwards, then the pressure at the trailing edge must be slightly above the freestream value and approach this further downstream. We may think of this flow (a) as representing the velocity component normal to the isobars on an infinite sheared wing. Since we are interested in the design of swept wings, we would like to realise this type of flow, as far as possible, also when the mainstream Mach number is supersonic. For these reasons, we shall not concern ourselves much with transonic flows like (b), (c), and (d) in Fig. 4.54.
At this point, we consider in more detail some of the physical features of the flow (a) of Fig. 4.54. We follow the reviews of transonic flows by D W Holder
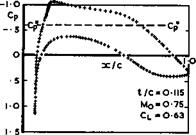
(1964) , H Yoshihara (1972), R C Lock (1972), and G Y Nieuwland & В M Spee (1973) and begin with the simple case of a thin aerofoil at a small angle of incidence (free D KUchemann (1957)). The experimental curves in Fig. 4.56 (full lines) show a very rapid expansion around the leading edge, followed by a narrow region of supersonic flow as soon as the critical Mach number is exceeded. At higher mainstream Mach numbers, the flow settles down to a nearly constant local Mach number of about 1.2 in the supersonic region, which is terminated by a
shockwave roughly normal to the stream. Downstream of the shockwave, the local Mach numbers are not as low as would be expected from normal-shock relations^ but fall to only about unity and then approach quickly the subsonic distribution calculated for the subcritical flow at that Mach number and angle of in-
cidence, i. e. the remaining compression to a pressure slightly above the mainstream pressure is achieved in a subsonic manner. There is no indication of any large-scale flow separation. As long as the supersonic region does not extend beyond the crest of the aerofoil (where the slope of the surface is in the direction of the mainstream), there are suction forces along forward-facing surfaces and a subsonic compression along rearward-facing surfaces. Thus the drag rise may be only moderate until the shock reaches the crest (see G E Nitz- berg & S Crandall (1955), and this particular condition is meant to be indicated by case (a) in Fig. 4.54 and by point (a) in Fig. 4.55. This, then, is a kind of flow one would like to achieve in practice but with aerofoils of much greater thickness-to-chord ratios and at higher lift coefficients, which implies that the local supersonic Mach number should be significantly higher than 1.2.
The flow implied in Fig. 4.54 (a) and Fig. 4.56 may be thought of as consisting of several regions and flow elements, which must be determined and matched to one another: the flow near the attachment line, which is accelerated along the surface and outside it to sonic speed, leading to a sonic line, or surface, along which the local Mach number is unity and hence the pressure constant, in a uniform mainstream; the local supersonic region, embedded in a subsonic stream; the shockwave; the subsonic flow downstream of it and into the wake, with which we are already familiar; and the viscous flew region near the surface and in the wake, which must be compatible with the outer inviscid stream. This is, no doubt, by far the most complex flow pattern we have discussed so far,
especially when we include the possible flow separations, which are associated with it, and it is not surprising that our knowledge is sketchy and uncertain. Why it is worthwhile to go to so much trouble in trying to clarify these matters and to apply the results in aircraft design can be seen, for example, from the results in Fig. 4.8; the question will be taken up again in Chapter 5.
A new flow element is the local supersonic region. In the simplest model, this may be thought of as containing two families of simple characteristic waves’. those running downstream from a point on the surface carry its expansive disturbances; since these cannot continue into the subsonic flow beyond the sonic line, it is usually assumed that they are reflected at the constant-pressure sonic line as waves of equal strength but opposite sign; these incoming waves thus carry compressive disturbances. This simple model cannot be quite complete. A knowledge of the propagation of simple wavefronts alone is not sufficient, and it is important to calculate the group velocity which, as a whole, gives the propagation of energy. Further, the reflected compression waves will again be reflected when they meet the surface and, unless the surface is convex enough*), the reflections will again be compressive. Energy may drift rapidly into these reflected compression waves and they may coalesce to form a discontinuous shockwave. A "transonic controversy" raged over many years on the question of whether such a shockwave Would inevitably appear or whether shockfree compression flows could exist. A shockfree flow would, of course, be desirable as it would give extra lift without a drag increase. This controversy may now be regarded as having been resolved in 1968 (see e. g. AGARD
(1968) , D Ktichemann (1969)), and we refer here only to some particular cases where shockfree flows have been demonstrated experimentally.
H H Pearcey (1960) showed that a useful isentropic compression could be obtained (see also H H Pearcey & J Osborne (1970)), and then G Y Nieuwland designed a family of aerofoils with shockfree flow and demonstrated experimentally that this shockfree flow existed (see e. g. G Y Nieuwland & В M Spee (1968), В M Spee & R Uijlenhoet (1968), H I Baurdoux & J W Boerstoel (1968), and R C Lock
(1970) ). An interesting contention, inferred from these experimental observations, was that the shockfree design flow condition is embedded in, and can be reached in a stable manner from, the neighbouring conditions at lower or higher mainstream Mach numbers; but these themselves involve shockwaves. Here, we show in Fig. 4.57 a lifting aerofoil, which is nearly twice as thick as that in Fig. 4.56 and carries more lift, but has a shockless supersonic region, as calculated by F Bauer, P Garabedian & D Korn (1972). The characteristics taken into account in the supersonic region are indicated, and this demonstrates clearly the flow model we have in mind. This aerofoil is typical for designs which have a local supersonic pressure distribution of almost roof-top shape and a significant amount of rear loading (see also Section 5.2). Consequently and deliberately, there is a marked curvature in the pressure distribution at the back of the roof top near the sonic point there. In a real viscous flow, this may lead to the formation of a shockwave, after all, as it did in experiments by J J Kacprzynski et al. (1971) (see also J J Kacprzynski (1973).
Another case of a shockfree transonic flow is that in a curved channel bounded by a pair of streamlines of a flow obtained by F Ringleb (1940) as exact solutions of the differential equations of an adiabatic gas. This has been investigated experimentally by G E A Meier & W Hiller (1968) and G E A Meier (1974),
*) …. …
Special problems arise, even in inviscid flow, when the wall has a significant curvature. What happens when a normal shockwave meets a curved wall has been clarified by К Oswatitsch & J Zierep (1960) and R Bohning & J Zierep (1975).
first with the boundary layer along the wall with the local supersonic region (symmetrical fore and aft) sucked away completely and then with less or no suction. Without the boundary layer, a stable shockfree flow according to the
|
|
|
Fig. 4.57 Shockless lifting aerofoil with characteristics indicated in the supersonic region |
theory was obtained up to and including the design condition where the highest local Mach number was 1.25. When the design velocity was exceeded, or when the boundary layer was not sucked away completely, the flow separated in the adverse pressure gradient at the rear of the supersonic region and one or several shockwaves appeared. The interaction between the shockwaves and the boundary layer took the form of a bubble underneath the shock system, as discussed in Section 2.4, and the flow element involved is of the type sketched in Fig. 2.11 but possibly with a longer bubble. In this particular channel flow, an unsteady peviodia motion resulted with strong oscillations. The mechanism involved appeared to be that the shock-induced separation caused the downstream pressure to rise and that this pushed the shock in the upstream direction, together with the separation point. The shock strength decreased during this phase and the shock arrived in areas with small pressure gradients. The velocity in the flowfield then reached a minimum and the shock disappeared altogether. The flow became attached to the wall again and the bubble floated downstream. In the following acceleration phase, the supersonic region grew again and, when it had reached a certain size, the shock reappeared at the downstream end and the whole process was repeated. We shall see below that oscillating shockwaves have also been observed on wings.
Although the transonic controversy may be regarded as having been resolved in principle, it is by no means clear and predictable what happens in any given case and how shockfree flows can be achieved in practical designs. We must be prepared to find that viscous interactions may lead to the formation of shockwaves, after all, and also that the flows may be unsteady. At this stage, appeal must be made to experiment to sort matters out.
We can infer from these cases that it is especially important to consider not only the flow at the design condition but also at off-design conditions. Therefore, we may look next at some typical observed flows over twodimensional aerofoils and how the local Mach number varies along the upper surface in off-
 |
|
 |
 |
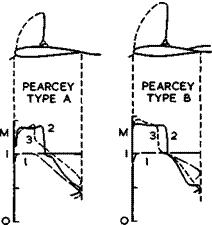
design conditions. The flows are all of the kind (a) in Fig. 4.54. In the cases shown in Fig. 4.58 (see D KUchemann (1970)), the freestrearn Mach number is high subsonic (0.8, say), and kept constant. We compare an attached flow
Fig. 4.58 Various flow patterns of twodimensional aerofoils at a given subsonic Mach number (schematic) at some initial, or design condition (dashed lines) with flows which may occur at some different conditions (some higher angle of incidence, say) where the matching between the viscous flow and the inviscid external stream requires some essential changes from the attached streamline flow. Every time, the essence of the problem is the question of whether or not one or several flow elements can provide a compression which is strong enough to let the pressure rise after the initial expansion, and the Mach number fall, near the trailing edge, to a value which is near the freestream value, so that there is a smooth outflow into the wake.
Three curves are shown in each of the cases in Fig. 4.58. The curves marked
(1) may be regarded as representing design conditions, where the flow is nominally attached up to the trailing edge. Four different types of design pressure distributions are shown. Case (a) shows a short roof-top distribution at the critical Mach number and case (b) a relatively long one. In the latter case, the adverse pressure gradient is supposed to be so steep that rear separation is only just avoided. In case (c), the flow has been designed to become supersonic locally near the leading edge and to return to subsonic Mach numbers through a shockless compression, as discussed above. In case (d) it has been assumed that a flow may exist where the compression is partly shockless and partly through a shock. It has also been assumed that the shock is in its rearmost position, where the boundary layer can just provide the remaining pressure rise which is needed in an attached flow when the trailing edge is subsonic.
There must be a limiting condition in each case beyond which the postulated flow can no longer be maintained and gross departures must be expected to occur, which cannot readily be tolerated in engineering applications, such as
severe unsteadiness and buffeting. The full lines marked (2) in Fig. 4.58 are meant to indicate such limiting conditions and the dotted lines marked
(3) are meant to indicate "unacceptable" conditions beyond these limits. Shockwaves are expected to occur now in all cases.
In the intermediate cases between the design and the limit, the pressure rise required may be achieved through a shockwave interacting with a bubble that reattaches. In the limiting cases, the bubble at the foot of the shock may either have lengthened or be about to burst, which leads to a flow which has been called type A by H H Pearcey (1968). Alternatively, there may be an incipient rear separation, which has been called type В by Pearcey. These are useful distinctions of practical importance which have been made before in the context of stalling (Section 4.7). In all the unacceptable cases marked (3), a large bubble, beginning at the foot of the shock and extending beyond the trailing edge, is assumed to have occurred. Even though there may be some pressure rise along this separation bubble, the pressure at the trailing edge is now significantly lower than in attached flow (the pressure rise needed to bring the pressure back to the freestream value then occurs at the end of the bubble downstream in the wake). This usually rather sudden change in the trailing-edge pressure can readily be detected in experiments. It may be taken as a sign for the onset of the rapid lift loss and the rapid drag rise indicated in Fig. 4.55.
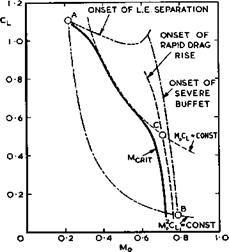
Various operating conditions of practical interest may be summarised in a diagram of Cl(Mo) , following H H Pearcey & J Osborne (1970). Fig. 4.59 shows a typical variation of the critical Mach number, which coincides over some
|
Fig. 4.59 Some significant flow boundaries on a twodimensional aerofoil. After Pearcey & Osborne (1970) |
range with a line MqCl ■ constant; and also a typical line along which Mq^Cl – constant, which simply indicates conditions for steady flight at the same altitude, here assumed to be sea level. At point A, the minimum speed for take-off and landing is reached (ignoring here that variable wing geometry may shift this point to CL~values which are much higher than those
of a single aerofoil, as in Fig. 4.1). For simplicity, point A is located on a line where a large-scale leading-edge separation is assumed to occur, and this could be shock-induced, as discussed above. The maximum speed at sea level is reached at point В, and here we are near the limiting cases
(2) in Fig. 4.58. Point C is meant to indicate the cruise Mach number which gives the best range, payload, and block speed. This may be somewhat above the critical Mach number at the foot of the rapid drag rise (point (a) in Fig. 4.55 and case (a) in Fig. 4.54). This is probably the type of flow of greatest practical usefulness. Note that it involves embedded shockwaves. The limiting cases (2) in Fig. 4.58 correspond to the line in Fig. 4.59 where the onset of severe buffet may be expected. All the boundaries shown in Fig.4.59 and the flow properties at all the operating points must be known when designing an aircraft. The flow must also be known well beyond the buffet boundary to cope with intentional or inadvertent flight manoeuvres and conditions. The subsequent discussion of what can be calculated or estimated by available methods should be seen in this light.
There is a multitude of methods for calculating the twodimensional inviscid flow past aerofoils. Early theoretical work by К Oswatitsch (1947) and H W Emmons (1948) was followed by the discovery of transonic similarity laws, independently and at much the same time by К G Guderley (1946), by Th von Karman (1947), and by К Oswatitsch (1947), based on the assumption that all the velocities in the field are in the neighbourhood of the speed of sound, i. e. the flow is assumed to be similar to that in case (c) of Fig. 4.54^but the equations of motion, which can be simplified accordingly, are then applied also to other types of flow.
The similarity laws follow from the potential equation (2.3) or (4.21) which is simplified into (2.28) with 62 ■ 1 – M2 , where M is now the local Mach number, assumed to be close to unity. Without actually solving this equation, it can be deduced that affinely-stretched aerofoils which have the same value of the similarity parameter
1 – Mq2
К —– яу, (4.131)
(t/c)2/3
have local pressure coefficients related in the ratio (t/c)2^ and drag coefficients proportional to (t/c)5/3 . Wings of finite span must have aspect ratios related by (t/c)~l/3 . These laws are still being developed further (see e. g. H К Cheng & M M Hafez (1973)).
Methods developed on this general basis have proved useful in some ways and solutions of the transonic flow equation exhibit some of the important features observed in experiments. The results obtained throw some light on the physical nature of the flow pattern and hence aid the design and interpretation of experimental investigations. Typical of this approach is the work of Oswatitsch and his school (see e. g. К Oswatitsch (1950), H E Sobieczky
(1971) , К Oswatitsch & R E Singleton (1972), H Norstrud (1972)). A powerful and practical integral method is that of D Nixon & G J Hancock (1973). On a similar basis, J R Spreiter & A Alksne (1955) developed a method of local linearisation (see also J R Spreiter (1962)). In this the factor 82 in
(2.28) is variously replaced by
![]() (у + 1) |i or 2MI ^1 + X-=-LM2^ f| or MqCy + 1) ||
(у + 1) |i or 2MI ^1 + X-=-LM2^ f| or MqCy + 1) ||
The equation can be solved with any of these approximations and there is no reason, in principle, why one should be preferred to the others. J R Spreiter & S S Stahara (1975) have applied the method of local linearisation also to unsteady transonic flows. Spreiter’s method has been adapted by J Rotta (1959) to calculate the velocity distributions upstream and downstream of the shock.
To determine the position of the shockwave, Rotta applied a criterion by A Betz (1943) concerning the drag of the aerofoils in an inviscid flow, the drag calculated from the pressure distribution around the surface of the aerofoil should be the same as that calculated from the momentum changes in the stream (see Section 3.1), which in this case includes shock losses in the form of entropy increases. This provides a powerful tool for checking the accuracy of any approximate method, and one might wish that such a check would be considered mandatory by the producers of the many other numerical methods which we shall discuss below. Rotta’s method gives a complete and consistent pressure distribution around the aerofoil and has the advantage of physical realism. Another method of practical usefulness has been developed by C S Sinnott (1959) (see also C S Sinnott & J Osborne (1958)) and extended by D G Randall (1958).
The flow is again divided into regions: upstream of the shock, the shock itself, and downstream of the shock. Basically, the flow upstream of the shock is always taken as that in a sonic stream, but Sinnott included also the effect of the incoming family of compression waves and found an empirical relationship for the local Mach number at the crest in terms of a parameter based on nose geometry and hence determined the whole compressive effect. Thus departures from the sonic-range distribution of the local Mach number upstream of the shock can be taken into account, as long as these are relatively small and the sonic-range distribution is approached from below. This method has been refined further by N Thompson & P G Wilby (1968) and a routine procedure has been provided by N Thompson (1969). Deficiencies become apparent when departures from the sonic-range distribution are large, as is often the case with more modern aerofoil sections. There are some other methods using integral equations and applying a technique introduced by A A Dorodnitzyn (1959), but the treatment of flows with embedded shockwaves has proved to be very difficult. Others, such as the NLR Method of G Y Nieuwland (1967), use hodograph methods based on the work of M J Lighthill (1947) and T M Cherry (1950) but, again, these are not suited to treat flows with shockwaves.
In recent years, a number of numerical computer methods have been developed (see e. g. H Lomax (1975)). These are primarily of numerical interest and are not discussed here in detail. They have been reviewed by M G Hall & M С P Fir – min (1974) and by M G Hall (1975), applying the criteria: accuracy, adaptability to practical configurations, and cost. Most of the recent advances have been achieved through the use of finite-difference methods, where difference approximations are introduced in place of the derivatives in the governing partial differential equations to reduce the problem to one of solving algebraic equations. The methods are usually divided into two main types: time – dependent and relaxation methods.
In the time-dependent methods, the required steady-state solution is regarded as an asymptotic condition to be obtained by advancing in time. (Note that there is, of course, also a real physical problem of accelerated or decelerated flight through the transonic speed range – see e. g. M Wittmann (1973)). This has the advantage that throughout the computation the equations remain of the hyperbolic type and, above all, that the flows may contain real shockwaves which obey the classical Rankine-Hugoniot relations. In the method of R Magnus & H Yoshihara (1970), the shock is "captured" in the course of the computation and appears as a region of a severe pressure gradient, as an effect of
an "artificial viscosity". In the method of G Moretti (1971), the shock is "fitted" properly into the solutions as a discontinuity. The main disadvantage of time-dependent methods is their relatively high cost in computer time.
Relaxation methods have turned out to be considerably faster than time-dependent methods. The pioneer work was done by E M Murman & J D Cole (1971) (see also E M Murman (1971), J A Krupp & E M Murman (1972), F R Bailey & J L Steger
(1973) , and E D Martin & H Lomax (1974)). A simulated viscosity term is retained in most methods, and the main shortcoming is in the representation of shockwaves, when the flow is supposed to be isentropic. It may happen that the Rankine-Hugoniot relation is violated or that mass is not conserved across what appears to be a shockwave in a numerical scheme. Various ways of incorporating embedded shockwaves, after all, have been investigated by J van der Vooren & J W Sloof (1973), V E Studwell & J M Wu (1973), J L Steger & В S Baldwin (1973), E M Murman (1973), and G Moretti (1975). The accuracy of these methods may be improved by transforming the infinite physical domain to a finite computational domain, in the case of twodimensional flows. This was introduced by С C L Sells (1967) for plane subcritical flows and has been used by F Bauer, P Garabedian & D Korn (1972), who solve the exact equation for the velocity potential in transonic flows. An example of their results has already been shown in Fig. 4.57. Another method for solving the exact equations has been developed by A Jameson (1974) and (1975). Really fast and practical relaxation methods, which can also be applied to threedimensional flows when Mq < 1, are based on the transonic small^perturbation equation (TSP) with lin-
 LIVE GRAPH
Click here to view
2
earised boundary conditions, where the factor 3 in (2.28) is replaced by
К – (y + 1) Эф/Эх (4.133)
rather than by the factors in (4.132), with К from (4.131). In spite of the assumption that the local as well as the mainstream Mach numbers are close to
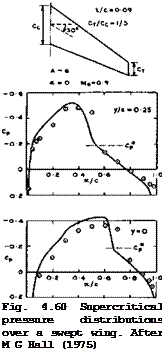
unity, which is the justification for all the simplifications made, the methods are then generally applied to flows where this is far from true. Such a method has been developed by С M Albone et al. (1974) and С M Albone (1974). In this RAE TSP-Method, a factor Mgr is introduced in the denominator of (4.131) where the value of r is arbitrary and can be used to adjust the results quite widely. Some further freedom of adjustment can be obtained by using suitable forms of the relation between velocities and pressures. The particular TSP equation for threedimensional flows may be found in С M Albone et al.(1975) As might be expected, this methodwith suitable choices of the available arbitrary parameters, can be made to yield results for some cases that are barely distinguishable for practical purposes from tne corresponding solutions of the exact potential equation, even when the perturbations are far from small and the mainstream Mach number is not near unity. Typical results obtained by this method for a threedimensional wing (which is the symmetrical version of the wing in Fig. 4.26) are shown in Fig. 4.60, where the circles are experimental points. We find that there are still some shortcomings in accuracy when there are shockwaves of only moderate strength in a threedimensional flow (but the calculated results could be adjusted further and be made to agree completely with the measurements by yet another choice of the arbitrary parameters – see С M Albone (1975)).
In spite of this present emphasis on numerical methods, wing design remains more of an art than an exact science, as it has always been (see also Chapter 5). In the computer methods, the physics of the flow are well hidden, and design hints do not normally emerge. But the basic physical principles of efficient section design have been fairly clear from the early days of studying transonic flows: to obtain high lift and low drag, at a given mainstream Mach number, the sonic line should be close to the attachment line, followed by a rapid expansion to a local supersonic Mach number which then requires a compression down to sonic speed, that can be realised without a large-scale separation in a viscous flow and should be completed just upstream of the crest. What is wanted are low pressures over a forward-facing surface. Also, the line indicating the onset of the rapid drag rise in Fig. 4.59 should be as far away as possible from the line indicating the critical Mach number. Thus attention must be paid primarily to: the accelerated flow in the region of the leading edge; the delicate balance between expansion and compression waves in the supersonic region, upstream of the crest; the viscous interactions, especially at the foot of a shockwave; and the final subsonic compression. The unfortunate fact is that there is still no rational method for designing shapes which exploit these principles to their physical limits and reach these aims. Thus much of the development of aerofoils has depended on making use of experimental observations.
Some shape characteristics which serve these purposes have been described by A Busemann (1941). В Gothert (1943) conducted a systematic series of windtun – nel tests on aerofoils where camber was used to reduce the suction peak near the leading edge at subcritical speeds and thus to increase the critical Mach number. He found that the symmetrical aerofoils in the series had indeed lower critical Mach numbers because of their higher subcritical suction peaks, but that the supercritical development of the flow was much more favourable in the sense described above, so that the actual rapid drag rise was postponed to significantly higher mainstream Mach numbers than on the cambered sections, where a shockwave appeared later but then moved rapidly rearward, gathering strength, and the drag began to rise as soon as the critical Mach number was exceeded. An example is shown in Fig. 4.61 (see also F W Riegels (1947)), where the "conventional" design designates a section with 4% camber and the
197
"peaky" design the corresponding-symmetrical section. (That the drag actually falls slightly before it rises sharply is a consequence of viscous effects at the Reynolds number of the tests when CL is kept constant). The difference
 |
in the Mach number at possible operating points marked by circles (where MqL/D is the same) is considerable. Also, the difference between the critical and the drag-rise Mach numbers is very large on the peaky section; for example, these numbers are 0.44 and 0.72 for Gbthert’s peaky aerofoil at Cl = 0.6. Similar differences have been found on aerofoils designed by H H Pearcey (1960).
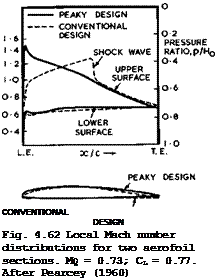
The results given in Fig. 4.61 were obtained for the shapes (with t/c = 0.08) shown in Fig. 4.62, which also clearly indicate the difference in the distributions of the local Mach number: the conventional aerofoil has a shockwave far back beyond the crest, the peaky aerofoil a shockless flow. However, the advantage cannot be attributed wholly to shockless flow – the aerofoils tested by GSthert all have supersonic regions terminated by shockwaves; it depends on how strong they are and where they are located. Even larger postponements of the actual rapid drag rise have been observed on annular air intakes by H Ludwieg (1943) on aerofoils designed by D Kiichemann & J Weber (see also.
H Ludwieg & G Oltmann (1945), D Klichemann & J Weber (1953)), as can be seen from the results plotted in Fig. 4.61. (In these cases, the radial force coefficient, which corresponds to the lift coefficient on aerofoils, was about one). Supersonic regions extend right round the leading edge of the peaky design and the shockwave moves rearward very slowly with Mach number and reaches the crest at a Mach number which is much higher (about 0.88) than the critical Mach number (about 0.62). Thus the overall suction force over the forwardfacing surface is nearly as high in the supersonic regions terminated by shockwaves as in subcritical flow (see (3.84) in Section 3.7). Consequently, the initial drag rise is quite small. So far, the design of twodimensional aerofoils has not reached what appears to be possible on annular aerofoils. Anyway, present aerofoils, such as that in Fig. 4.57, have not been designed with these principles in mind. Thus further improvements may be possible but, to be useful, theoretical tools must then be able to deal very accurately with the leading-edge region.
Next, we consider briefly some effects of viscosity which are particularly important in transonic flows. We mean by that the physical effects of the real viscosity, not the artificial viscosity introduced in some numerical methods to make them tractable. Interactions between shockwaves and boundary layers have been studied intensively, from the early pioneering work by J Ack- eret, F Feldmann & N Rott (1946) and H W Liepmann (1946) to G E Gadd (1953),
J Seddon (1960), H H Pearcey (1961), M Sichel (1968), M G Hall (1971), H M Brilliant & T C Adamson Jr (1973), I E Alber et at. (1973), and W L Hankey &
M S Holden (1975). Even so, many aspects of these viscous-inviscid interactions are not yet clear and much remains speculative. We follow here mainly the reviews by J E Green (1969) and (1971) and consider those flows in which the development of the boundary layer and wake has a significant effect on the overall pressure field. There is a whole spectrum of flows: at one end, when the flow remains fully attached, we may have the relatively weak interaction by which the growth of the boundary layer and wake leads to a change in the pressure distribution along the surface and hence, integrated overall, to a reduction of the lift and an increase of the pressure drag. These effects are of the kinds already discussed in Section 4.5, and they may be treated by an iterative process. But the viscous effects may be greater, and react more sensitively to changes, in transonic flows, and there are strong doubts about the validity of the displacement concept in local supersonic regions (see below) . At the other end are the interactions in which there is not only a strong coupling between boundary-layer growth and the local pressure field but also a pronounced effect on the overall pressure field and hence on lift and drag. Examples of this strong interaction are shock-induced separations as in cases (2) of Fig. 4.58 (a) and (d), or rear separations as in cases (2) of Fig. 4.58 (b) and (c) (large-scale separations as in cases (3) of Fig. 4.58 change the type of flow altogether and are no longer called interactions here). Intermediate between these flows in the spectrum are the interactions beneath shockwaves and at trailing edges in flows which do not separate. In these, the coupling between the boundary layer and the pressure field is strong locally but relatively weak in an overall sense. Nevertheless, the matching between the inner viscous flow and the outer inviscid flow must be expected to govern to a significant extent the ahordwise position and strength of the compression system, even in the intermediate case: calculations for inviscid flow only cannot be expected to give a realistic answer for shock position and strength. Flow elements involving rear separation have already been discussed in Sections 2.4 and 4.6; so we concentrate here on interactions associated with compressions, especially shockwaves.
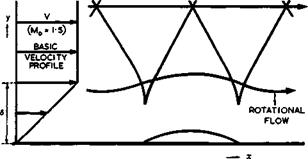
If there is a shookte88 compression, as in the case of Fig. 4.57, then the development of the boundary layer should be normal and calculable by existing methods in the second step of an iteration. But when the local supersonic region is then recalculated in the presence of the boundary layer, in the third step, it should be taken into account that the incoming and outgoing waves are not then reflected from the solid surface, but in a different way from the sonic line inside the boundary layer. A simple case is shown in Fig. 4.63, from calculations by D KUchemann (1938), where a mainstream at Mq = 1.5 with an inviscid but rotational shear layer underneath is perturbed (only slightly and
|
Fig. 4.63 Reflection of waves from an inviscid rotational layer along a wall |
periodically). Incoming compression waves in such a flow must cause a bubble separation; the bubble will reattach when the perturbations are periodic. It will also be seen how the waves curve and are reflected in a cusp at the sonic line (in this particular case at y/6 = 2/3). A virtual reflection point, as from a solid wall, would lie at y/6 =0.82. If there had been no shear layer, the outgoing waves would be more than one boundary-layer thickness downstream of where they are in Fig. 4.63. These values may be typical of laminar layers; the shift should be smaller in turbulent layers where the sonic line lies deeper inside the layer. It does not appear that these effects have been included in any theory of transonic flows. They matter especially when the boundary layer is relatively thick and when the flow depends on a delicate balance between compression and expansion waves (as in Fig. 4.57) so that the accumulation of the shift between ideal and actual reflected waves can seriously affect the flow pattern. In any case, it is clear that the displacement surface of the boundary layer does not have the conventional significance in this flow. It is not justified, therefore, to apply the displacement concepts described in Section 4.5 to local supersonic regions although, in the absence of a physically sound method, it is still being applied (see e. g. R C Lock (1975)).
In many real flows, including the theoretically shockless flow of Fig. 4.57, shockwaves do appear and we may assume that, in cases of practical interest with relatively high lift and low drag, shockwaves in one form or another will terminate the local supersonic region, as in all cases (2) of Fig. 4.58. The question is then: what flow patterns are possible at the rear end of such a supersonic region, so that we know the flows we should attempt to calculate and be able to measure.
Some flow patterns of these kinds, with turbulent boundary layers, are sketched in Fig. 4.64 as we can now visualize them. Case (a) shows an interme-
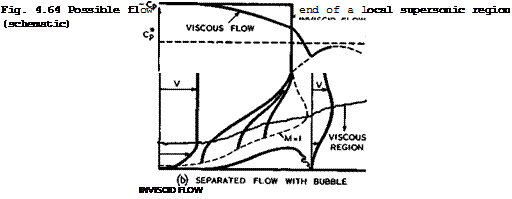 |
(Kate interaction without separation and case (b) a strong interaction with separation, and reattachment brought about by turbulent mixing further downstream. These patterns should be somewhat more realistic than the simple sketch in Fig. 2.11. In both cases, some of the fan of compression waves is indicated, as they coalesce into one shockwave normal to the stream outside
the viscous region. The sonic line bounding the local supersonic region is continued into the boundary layer in this model of the flow. (For the behaviour of isobars in boundary layers see D F Myring & A D Young (1967)). In both cases again, the region where the main shockwave splits up presents considerable theoretical difficulties. Even a simple three-shock intersection cannot be treated in a simple manner with straight shocks, as has been demonstrated by E Eminton (1961).
In case (a) of Fig. 4.64, the compressions have the effect of rapidly increasing the thickness of the boundary layer and also its momentum thickness, while reducing the fullness of the velocity profile. The velocity at the edge of the boundary layer downstream of the interaction may be higher than that behind the single shock further away from the wall. If the pressure gradient immediately downstream of the interaction in the subsonic region is fairly
small, the velocity profile may regain its normal shape within roughly ten boundary-layer thicknesses downstream of the shock, leaving an increment in momentum thickness as the principal residual effect on the boundary layer.
The influence of the viscous region on the flow underneath the shockwave is to soften its effect so that the pressure rise at the wall, rather than being discontinuous, is spread out over a distance of two or three boundary-layer thicknesses. Although boundary-layer approximations fail completely in the interaction region itself, the changes across it and the subsequent boundary layer development can be predicted with some confidence, provided any further adverse pressure gradients are not too severe (but see also P Bradshaw &
П I Wong (1972) on the relaxation of a turbulent shear layer). However, if pressure gradients downstream of the interaction are severe, as one would like them to be in practical cases, the prediction of the boundary-layer development in the second step of the iteration is less secure and otherwise adequate methods, such as those by J E Green et al. (1972), P Bradshaw et at. (1971), and M R Head & V C Patel (1969), may give appreciably different answers. One serious consequence of these shortcomings is that the margin against the onset of separation cannot reliably be estimated. In any case, the continuation of the iteration process so as to obtain a final answer for flows like that shown in Fig. 4.64 (a) has not yet received much attention. R E Melnik & В Grossman (1974) have treated weak interactions by subdividing the region into three layers: a thin viscous layer along the wall, at a pressure imposed from outside; an inviscid but rotational layer, with the pressure varying across it; and the outer potential flow. A similar model has been used by R Bohning &
J Zierep (1975) to investigate the effect of wall curvature. Both models result in a continuous pressure rise along the wall, without flow separation.
When the upstream Mach number is higher than that assumed in Fig. 4.64 (a), and this is likely to happen in most practical cases, we have a strong interaction where the pressure rise required in the viscous region is high enough to cause a flow separation. A somewhat elaborate model of a flow with a separation bubble underneath a shock system is shown in Fig. 4.64 (b), based on observations by J Seddon (1960). A system of oblique shockwaves over the front of the bubble provides part of the pressure rise, and turbulent mixing in the reattachment region at the rear of the bubble provides the remaining pressure rise required. (It has been assumed in this model that the pressure is still the same at the edge of the viscous region as that at a point on the wall underneath, which is, of course, a very doubtful oversimplification).
No doubt this flow element is essential in mixed transonic flows of practical interest, and answers from present theoretical methods cannot be accepted with any confidence until it is adequately incorporated.
Apart from the need for calculating such a flow in detail, there are three main questions to be answered to define the range of existence of such a flow: What is the overall pressure rise which will cause separation? What is the scale of the separation and the length of the bubble (in terms of the thickness of the undisturbed boundary layer)? What are the conditions for the bubble to burst! A rough answer to the last question has been given in Section
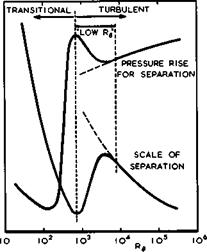
2.4, where it has been argued that the pressure rise through turbulent mixing is limited and that a pressure-rise coefficient (2.39) cannot exceed certain values. When the bubble bursts, the flow changes completely into one with a very large separated region extending beyond the trailing edge, a situation described as Pearcey type A in Fig. 4.58. As to the first two questions, we can only refer to a conjecture by J E Green (1971), which is illustrated in Fig. 4.65 (because of its conjectural nature, no scale is shown in this figure). Existing evidence by D R Chapman et al. (1957) and by A Roshko & G J Thomke
(1969) for supersonic flows has been used (see also P Carri&re (1973) and P CarriSre et al. (1975)), but this can only give a pointer to the behaviour in transonic flows and allow qualitative deductions. For a given overall pressure rise, both the onset of separation and the bubble length are expected to
|
Fig. 4,65 Green’s conjecture on the influence of the Reynolds number on the properties of shock-induced separation |
depend strongly on the Reynolds number. At high Reynolds numbers, the behaviour is characteristic of a fully-developed turbulent boundary layer and resistance to separation increases with increasing Reynolds number. As the Reynolds number is reduced from these high values, the resistance to separation passes through a minimum and, thereafter, increases with further reduction of the Reynolds number to reach a maximum corresponding, probably, to an initial boundary layer in the terminal stages of transition. There is thus an important "turbulent, low-Reynolds-number range", in which the flow properties change appreciably. To the left of this range in Fig. 4.65, the initial boundary layer is transitional or laminar and a particularly unpredictable type of interaction occurs. Typically, there may be a small initial pressure rise associated with separation of the laminar boundary layer, followed by a pressure plateau which may be quite long, followed by transition and rapid reattachment, which generates a pressure rise in the viscous region large enough to be compatible with that through a shockwave in the outer inviscid flow. (Note the resemblance between this flow and that involving long and short bubbles at low speeds, discussed in Sections 2.4 and 4.7). The pressure distribution is then dominated by the transition process and the interaction is especially difficult to predict, primarily because transition is poorly understood and also because it is sensitive to a wide range of extraneous influences. Thus the flow elements sketched in Fig. 4.64, which are central to the problem of wings in transonic flow, are as yet beyond the available theoretical means and recourse must be taken to experiment: the tool at our disposal for estimating the flow over full-scale aircraft is the windtunnel (see e. g. AGARD (1972) and
(1974) and A В Haines (1971) and (1975)).
Some estimates can be made if the flow model is simplified even further and
other empirical approximations introduced. The boundary layer is assumed to be turbulent in a method developed by F Thomas (1966) and F Thomas & G Redeker, (1971) and it is calculated using the method of A Walz (1966), for a pressure distribution where the subcritical part is determined by Weber’s method (see Section 4.3) and the supercritical part by Thompson’s extension of the method by C S Sinnott (1959). The pressure rise through the shockwave is replaced by a linear pressure rise in the boundary layer, which is assumed to extend over a distance of 4 local boundary-layer thicknesses. The onset of separation in the boundary layer downstream of the shock can then be calculated and Thomas & Redeker have obtained cases of Pearcey-type-A flows, where the separation point jumped abruptly forward to the shockwave, and also cases of Pearcey – type-B flows, where the separation point moved gradually forward from the trailing edge. R H Korkegi (1973) has shown that some simple extensions of twodimensional correlations for incipient separation are possible when the shockwave is swept but, generally, we do not know much about strong interactions with swept shockwaves.
An instructive example to demonstrate properties of transonic flows with shockwaves is the flow past a wavy wall. This has been treated theoretically by J Zierep (1972) and experimentally by H Jungbluth (1975).
It will be noticed that the discussion so far has been concerned mainly with twodimensional flows – an indication that our knowledge of transonic flows over threedimensianal wings is likely to be even poorer. In the brief survey that follows, we shall see that it is even more difficult than at subcritical speeds to transfer results for twodimensional flows to the situations found on threedimensional wings, and that mental blinkers, corresponding to thinking only in two dimensional terns, can be even more of an obstruction to prevent real insight. The RAE TSP Method has the advantage that it can be extended to threedimensional subsonic flows, and the example in Fig. 4.60 has already given an indication that threedimensional centre effects are at least as pronounced as in subcritical flows.
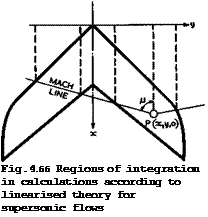
Another way of approaching the problem of the threedimensional flow past swept wings at transonic speeds (in the strict sense: near Mq = 1) is downward from supersonic speeds. There are well-developed theories for inviscid supersonic flows (see also Section 4.9), especially for cases where the wings are thin and the lift is small so that perturbations may be assumed to be small and the equations of motion may be linearised. These matters are explained in many textbooks already mentioned above (for the theory of wings see also G N Ward (1949), A Robinson & J A Laurmann (1956), and R C Lock & J Bridgewater (1967)). The simplest form of the equation of compressible potential flows is obtained by putting M 0 in (2.28). As it happens, the equation is then the same as (3.17) for the hypothetical twodimensional flow in the Trefftz plane behind a lifting wing or for the flow in any plane x = constant across a wing of small aspect ratio, which may be regarded as a Trefftz plane for the part of the wing ahead of it (see Sections 3.2 and 4.3). This connection between the theory of wings of small aspect ratio and the theory of wings in a sonic stream can readily be understood if we recall that, in the linearised theory of supersonic flows, a point P on the wing is influenced only by that part of the wing which lies ahead of the Mach lines through P (strictly, within the Mach forecone), as indicated in Fig. 4.66. The Mach lines are inclined to the mainstream at the Mach angle ц given by (3.43), so that p = ir/2 for Mq = 1.
We note that this linearised theory for transonic and supersonic flows is of interest to us mainly in those cases where the leading edges of the swept wings
 |
lie well within the Maoh acme from the apex. For example, all the cases shown in Fig. 4.8 lead to wings where the leading-edge sweep is significantly greater than that of the Mach cone through the apex (the dotted line gives values for ф = ir/2 – y). This theory then gives results for threedimensional effects which are related to those derived in Section 4.4 for subcritical flows
Consider, for example, the kink effect at the centre section of a swept wing. At subcritical speeds, both induced velocities due to thickness, (4.86), and due to lift, (4.93), contain threedimensional kink terms ("Ackeret terms") which are proportional to the local source or vortex strengths respectively.
 |
|
At transonic and supersonic speeds, only these same kink terms remain and the first twodimensional-flow terms vanish altogether. Thus the threedimensional centre effect dominates the flow more and more as the Mach number is increased This can be seen very clearly from the drag force associated with the centre effect, obtained by integrating the pressure distribution around the surface. For thick wings at zero lift, for example, linearised theory gives at all speeds (see D KUchemann (1957)):
if the aspect ratio is large enough to leave the centre unaffected by the wing tips. This includes (4.89) as the special case for Mq = 0. For a biconvex parabolic section,
О
and for a double-wedge section, I = (t/c) . Note that these results do not conform to the similarity parameter from (4.131), which should cast some doubt on the validity of the TSP treatment.
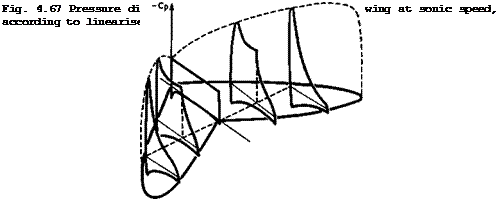
Linearised theory allows the pressure distribution over the wing surface to be calculated (see e. g. К W Mangier (1951), C R Taylor (1959)). A typical example is shown in Fig. 4.67, which may be compared with the pressure distribution over an unswept wing at Mq = 0 in Fig. 4.15 and with that over a swept wing at Mq = 0 in Fig. 4.24. At Mq = 1, the central part of the wing is
even less loaded up than at Mq = 0 and, for a thin wing, the chordwise loa
ding along the centre section is constant, i. e, the whole pressure rise is supposed to take place at the trailing edge, as in the supersonic flow in Fig.
3.7 (although Prandtl-Meyer expansions and shockwaves are not allowed for in this linearised theory). At other spanwise stations, the slightly positive pressure coefficient at the trailing edge is reached in a subsonic manner, as long as the trailing edge is swept behind the Mach lines, which is of course fulfilled at Mq * 1 but also at Mq > 1 in most cases of practical interest. The pressure distribution has an infinite slope (not a shockwave) along the Mach line through the trailing edge of the centre section. It is assumed
 |
LIVE GRAPH
Click here to view
in Fig. 4.67 that the leading edge is curved all the way to the tip. If the planform has a streamwise tip, then there is no load behind the Mach line through the leading edge of the tip.
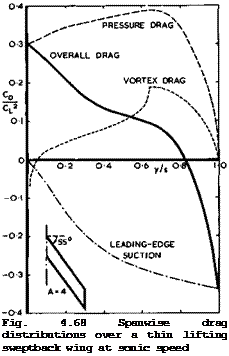
Some further insight into the properties of this type of flow can be gained from Fig. 4.68, which shows the distribution of the drag due to lift across the span of a flat sweptback wing at sonic speed, as calculated by J H В Smith
(1957) . This may be compared with curves (B) and (C) in Fig. 4.33 for Mq = 0. There is one curve for the vortex drag associated with the trailing vortices, which is found again in the Trefftz plane behind the wing. Another curve shows the overall drag, which differs significantly from the vortex drag, and the difference between these two curves indicates the large drag and thrust forces which still cancel one another at sonic speed. As in subcritical flow, the regions influenced by the centre effect and by the tip effect are clearly apparent. In between, there is no region left around mid-semispan where the flow may be assumed to be similar to that over an infinite sheared wing, in this particular case. In Fig. 4.68, the overall drag is further subdivided into the pressure drag normal to the wing surface and the suction force tangential to the chordline, which is supposed to act at the leading edge of the wing. The latter is zero at the centre of the wing, as in subcritical flow, but grows very large towards the tips. To realise this leading-edge thrust in practice, and thus to avoid large drag increases by losing it, is one of the main design aims of swept wings. These matters will be discussed further in Chapter 5.
The overall drag due to lift in inviscid flow is still entirely vortex drag at Mq = 1. But the local drag and thrust forces due to thickness no longer cancel each other and an overall wavectrag remains at Mq • 1, and also for Mq > 1. This wavedrag may be estimated either by integrating the pressures over the surface or from considerations of the farfield, as explained in Section 3.1. For swept wings and for slender wings at near-sonic speeds, this drag is related to that of a body of revolution with cross-sections which have the same area S(x) as the cross-sectional areas of the wing in planes normal to the mainstream: as far as the farfield is concerned, the source distribution representing the wing may be replaced by a source distribution along the axis of symmetry as long as the source strengths in planes x = constant are the same. This leads to the equivalence rule of F Keune & К Oswatitsch (1952): the difference between the flow past a thick wing and the flow past the equivalent body of revolution is an incompressible flow which obeys (3.17). This leads to very simple relations for the variation of the pressure coefficient with Mach nunfcer, which differ from the Prandtl-Glauert and Ackeret rules
► (4.135)
An even simpler rule for the drag, the area rule, results, in the special case when the equivalent body ends in a point or in a cylindrical portion parallel to the mainstream: the drag of the wing is then the same as that of the equivalent body of revolution and does not depend on the Mach number. This conclusion was reached also by R T Whitcomb (1952) and by W T Lord & E Eminton
(1954) , and a practical method for evaluating the integral involved has been provided by N A Routledge et al. (1954). The whole subject has been reviewed
by К Oswatitsch (1957). The area rule is often used for design purposes to keep the drag low (hut see also Sections 5.6 and 6.7 for further discussion of reservations about the effectiveness of the area rule). The body of revolution with the lowest wavedrag is that of W Haack (1941) and W R Sears (1947); the drag is then given by (3.44) with Kg = 1.
There remains the question of how far this body of small-perturbation theories can be applied to wings of practical interest. The perturbations may be sufficiently small and the theories could give useful answers if the pressure distributions at the design conditions were like those in cases (a) and (b) in Fig. 4.8, or like those in cases (1) in Fig. 4.58 (a) and (b), and if these conditions were never exceeded. But we have already seen that much higher local Mach numbers are likely to occur, in both design and off-design conditions, so that we have to deal with mixed transonic flows (in the second sense defined above) in many practical cases. Perturbations cannot then be assumed to be small. Such flows will occur all along curve (c) in Fig. 4.8, even though the leading edge is still nominally subsonic and lies well within the Mach cone. The theories for threedimensional wings, just mentioned, do not then apply, and it is doubtful whether the flow implied in Fig. 4.67 can be realised in practice.
To replace Fig. 4.67 by a more realistic model of wings with mixed flow, we must rely mainly on speculative reasoning and on experimental evidence (see e. g. D Kiichemann (1957), EWE Rogers & I M Hall (1960), A В Haines (1971),
J E Green (1971)). To explain some of the features we think such a flow should
|
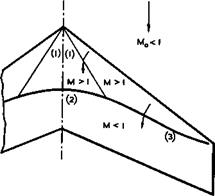
Fig. 4.69 A possible basic shockwave pattern on a supercritical sweptback wing |
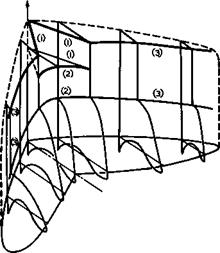
have, we may consider first a very simple model, as shown in Fig. 4.69, where the mainstream Mach number is subsonic, the angle of sweep moderate, and where we assume that no flow separations occur, except at the trailing edge. The flow expands around the leading edge to a local supersonic Mach number which, for simplicity, is taken to be the same all along the span. (If the local Mach number varies suitably along the span, one can think of a shockless compression in the central region, but the compression waves are then likely to coalesce into a single shockwave further out along the span). The flow downstream of the leading edge is then directed inwards towards the centreline. It must be tupned into the mainstream direction along the centreline itself for reasons of symmetry, and the simplest way of achieving this turn is through an oblique shockwave (1), beginning at the apex of the wing. This leaves a parallel flow behind, which is likely to be still supersonic. Thus a further shockwave (2) is needed to bring the flow down to a subsonic Mach number and to allow a subsonic compression to raise the pressure to the required value at the trailing edge. The two shockwaves intersect at some point away from the centreline and a single shockwave (3) may continue towards the wing tip. The pressure distribution in such a flow then looks like that sketched in Fig. 4.70. This is quite different from that in Fig. 4.67 for the flow with small perturbations. Even in this very much simplified form, this flow past a typi-
|
-Cp
Fig. 4.70 Pressure distributions over a sweptback wing with supercritical flow |
cal supercritical wing cannot be reliably treated by any available theory.
All the flew elements and their matching problems which have been discussed above in connection with twodimensional aerofoils reappear in this threedimensional flow, but evidently in a more complex form. Centre and tip effects of the familiar kind are still strong but not now so readily identifiable. There is no reason to suppose that there should be a region in between where the flow resembles that past an infinite sheared wing. In addition, many new problems appear. For example, the whole shockwave system and, in particular, the inclination of its individual elements to the mainstream direction are not known. The flow near the triple intersection point, together with the vortex sheet that must emerge from it, is much more complicated than the corresponding twodimensional compression flow. Further, when flow separations occur as in shockwave/boundary-layer interactions, these need not take the comparatively simple form as sketched in Figs. 2.11 or 4.64(b); it must be expected that flow elements involving vortex-sheet separations, as in Figs. 2.12 and 2.13, may occur if the effective local angle of sweep is high enough. What this angle of sweep should be is determined by the overall flow, not directly by the geometric angles of sweep of the wing. Since vortex sheets which are continually fed with vorticity from a separation line must grow in space, concepts like infinite sheared wings can then not possibly apply. Quite generally, viscous-inviscid interactions are even more important in these threedimensional flows and they may dominate the problem of deciding which type of flow will occur in practice.
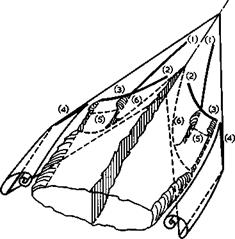
Flows like that implied in Figs. 4.69 and 4.70 have been observed in experiments but, in practice, we are also vitally interested in flows where the mainstream Mach number or the angle of incidence are higher, so that large- soale fZow separations occur. A typical example of such a flow is sketched in Fig. 4.71, from observations by G F Moss (1971) made on a sweptback wing at a subsonic Mach number (0.8). The shockwave pattern from Fig. 4.69 can
|
Fig. 4.71 Possible flow pattern over supercritical sweptback wing (schematic) |
still be recognised: there is a forward leg of an inboard shock (1), followed by a rear inboard shock (2); these intersect to form a single shock (3), but this has very little sweep and ends near the leading edge well inboard of the wing tip; further outboard, there may be another shockwave (4) close to the leading edge. In such a flow, various types of flow separation, discussed in Section 2.4, may occur simultaneously, as indicated in the simplified skeleton model of the flow sketched in Fig. 4.71. The outboard shock (4) may cause a leading-edge separation, and a coiled vortex sheet may spring from there and from a separation line along the tip edge. The nearly unswept shock (3) may cause a bubble separation with reattachment (5), leaving a relatively thick viscous layer behind. Along nearly all of the span, the flow does not reach the trailing edge but separates along a rear separation line (6) which leaves a thick wake behind in the form of a bubble which extends beyond the trailing edge. This, then, is one of the possible threedimensional counterparts of the flows in Fig. 4.58. It must be expected that the onset of the various flow separations is strongly dependent on the Reynolds number and that the criteria for this are more complicated than those for twodimensional flows indicated in Fig. 4.65. Again, we must rely on experiments since there is no theory to deal with these problems, but such experiments are themselves difficult to perform and reliable extrapolations to full-scale conditions need a new generation of high-Reynolds-number transonic windtunnels.
One reason why these types of flow matter so much in aircraft design is that some of them may be so unsteady that they limit the flight envelope. We have
already seen that there is no reason to suppose that a flow involving a shock- induced separation like that in Fig. 4.64(b) should be steady, and we know that rear separations are notoriously unsteady. The unsteady phenomenon of greatest practical importance is referred to as buffeting and defined as the response of the structure of the aircraft to aerodynamic excitation, which, when severe, makes the aircraft unflyable or causes fatal damage to the structure. An unsteady flow causes the pressure to fluctuate, and it depends on the nature of the excitation and on the properties of the structure whether or not the structure responds and, if so, in which rigid or flexible modes of deformation.
In view of the practical importance of this phenomenon, the aim on the aerodynamic side must be not only to determine the boundary of buffet onset, as indicated in the simple example of Fig. 4.59, but also to describe the behaviour beyond the buffet boundary. The importance, and difficulty, of clarifying what happens on wings in this separated-flow regime can be seen from the fact that, even now, about 1/3 of the windtunnel time spent on testing transport – aircraft projects, and about 2/3 of the testing time of fighter aircraft, is devoted to these flow conditions, according to J P Hartzuiker et al. (1975). There are some approximate methods for predicting the onset of buffeting on aerofoils and on wings, and we refer to a series of papers by F Thomas (1966),
F Thomas & G Redeker (1971), G Redeker (1973), and G Redeker & H-J Proksch
(1975) . These and various other prediction methods have been critically reviewed by H John (1974). The dynamics of buffeting have been investigated by J G Jones (1973), L Muhlstein Jr & C F Coe (1975), and by L E Ericson (1975), and windtunnel and flight measurements have been analysed by С E Lemley & R E Mullans (1974) and by C Hwang & W S Pi (1974). How the airframe may respond to unsteady forces on the wing has been treated by J C Houbolt (1975). An extensive review of various effects of buffeting has been given by W E Lamar (1975), and a series of papers dealing with the whole field of aircraft stalling and buffeting may be found in an AGARD Lecture Series directed by C R Taylor (1975). Here, we can only give a brief outline of some of the aerodynamic problems involved, following a review by D G Mabey (1973).
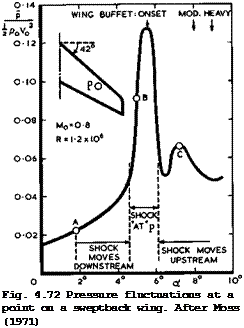
The aerodynamic excitation can be characterised by the rms level of the pressure fluctuations at given points, by their frequency spectra, and by the degree of correlation in space and time. Convenient non-dimensional parameters to describe the pressure fluctuations have been introduced by T В Owen (1958): a reduced frequency
 n = f L/Vq,
where f is the frequency, L a typical length scale, and velocity; and a buffet levet
p yj n F (n)
і 0ovo2
where F(n) is the contribution to the rms pressure fluctuation in the frequency band Af and є = Af/f the analyser bandwidth ratio. Typical wind – tunnel results measured at one point on a wing like that in Fig. 4.71 are shown in Fig. 4.72. The following explanation, by Mabey, of the variation of the pressure fluctuation with increasing angle of incidence is speculative because of the difficulty of discriminating between local events at the point P and what is happening simultaneously elsewhere on the wing, but it helps to define the flow problems. A shock system with at least three shocks is established
at a relatively low angle of incidence, and the pressure fluctuations at P (which lies behind shock (3)) first increase slowly with increasing angle of incidence (point A in Fig. 4.72) as the result of the combined effects of the shock itself oscillating backward and forward (shockwave dither) and of fluctuations in the attached turbulent boundary layer which grows under an increa-
 LIVE GRAPH
Click here to view singly adverse pressure gradient. The pressure fluctuations increase rapidly as the shockwave approaches and passes over the transducer position (point B) , and this must be expected to be caused mainly by an oscillation of the shockwave. The pressure fluctuations fall when a strong shock-induced separation occurs and when the shock moves forward again and they then build up to a second maximum (at point C) when the re attachment line at the end of the separation bubble passes over the transducer. The flow pattern sketched in Fig.
4.71 corresponds roughly to an angle of incidence slightly higher than that at point C in Fig. 4.72. On the particular windtunnel model tested, straingauges in the wing root measured the bending moment and thus gave an indication of the integrated excitation of the whole wing. Thus the onset of buffet of the whole wing could be determined, which is indicated in Fig. 4.72, and also points where Mabey has defined the buffeting to be moderate and heavy, the latter setting a limit to flight. This implies that flows like that in Fig. 4.71 may occur within the flight envelope.
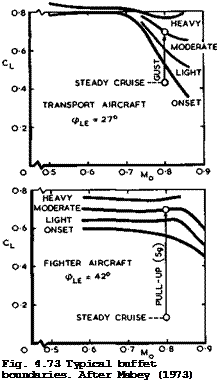
Excursions beyond the buffet boundary in flight may occur for different reasons: deliberately, in certain manoeuvres of fighter aircraft; involuntarily, in encounters with gusts for transport aircraft. To illustrate these two different situations, we reproduce in Fig. 4.73 typical examples given by D G Mabey (1973). Note that the boundaries in this figure differ significantly from those in Fig. 4.59 for a twodimensional aerofoil. This only illustrates the great variety of possible flows and thus the need for a comprehensive method of prediction. A transport aircraft may cruise at a C^- value which is about
0.1 below the buffet-onset boundary; on infrequent occasions, it may be carried up to moderate buffet levels when encountering a strong vertical gust (assumed here to have a speed of 12.5 m/s and a wavelength of about 33 m). A
 LIVE GRAPH
Click here to view
fighter aircraft may cruise well below the buffet-onset boundary; quite frequently, it may have to perform pull-up manoeuvres (assumed here to require an acceleration of 5 g), and these may carry it well beyond the buffet-onset boundary. In both cases, the mean, time-dependent, loads during these transient motions must be determined as well as the unsteady buffeting loads.
Quite typically, as in so many other cases discussed in this Chapter, we can see what the physical problems are, albeit rather darkly, but the theoretical approaches have not been carried very far toward their solution. This is why it is so in^ortant to have suitable experimental tools available.


