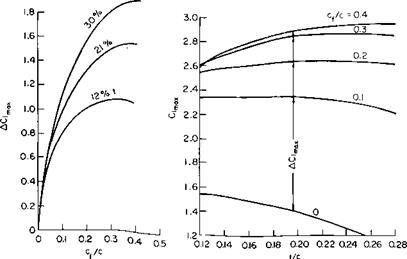
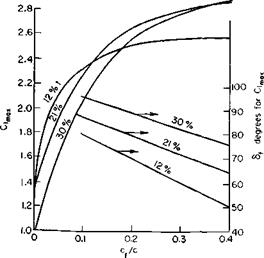
Two-Dimensional Unpowered Flaps
The trailing edge flap, considered first, can be divided into two types: those that extend the chord when deflected and those that do not. The Zap, Fowler, and most slotted flaps fall into the first category and plain or
167
 |
Fig. 6-1. Types of flap.
split flaps to the second. Obviously a flap that extends the chord will look better than one that does not if C, max is based on the unextended chord length. To make a rational comparison of one flap type against the other, the actual or extended chord is therefore used here. For example, a value of C, max quoted for a 30% chord Fowler flap in the literature was divided by 1.3 to compare with theory or experimental results of a plain flap.
There are several questions that must be answered in the application of any flaps:
1. How much does C, increase with flap deflection angle at an oc below
the stall?
2. How much does C(max increase with flap angle?
3. How does Cm vary with flap angle?
4. How does Cd vary with flap angle?
To answer these questions let us first consider thin airfoil theory, developed in Chapter 3, applied to a plain flap.
The chordwise vorticity distribution is expressed there in a Fourier series (3-7) with the coefficients given by (3-10). Referring to Fig. 6-2, we note that the angle of attack of the chord line with the flap deflected, aeff, is
ac + be,
aeff = ———————
C
or
c Cr
aeff = a + §—-
c
![]()
 |
![]()
These equations, of course, assume small angles.
From (3-16) the lift coefficient of the flapped airfoil becomes
С, = 2k + 2<5 sin 0f
or
![]() Cj = 2kol + 2(л — 6f + sin 0f) 8.
Cj = 2kol + 2(л — 6f + sin 0f) 8.
From the above C, can be written as
C, = 27t(a + xd)
where t is the flap effectiveness factor given by
. 0r — sin 0f
X = 1—————– ———————– -•
к
t is seen to be an effective rate of change in the angle of attack with 8.
The moment coefficient about the aerodynamic center, as given by (3-19), becomes for the flapped airfoil
Cm. c= -(gsin^. (6-7)
One other quantity of importance to a flap is the hinge moment. This quantity can be obtained from
H = – pV f y(x – xf)dx (6-8)
Jxf
or in dimensionless form
![]() H
H
%pV2C2
= —j* [л/-1 +. C°S ^ + Yj An sin «0 j(cos 0f — cos 0) sin 0 dO.
The expression for Ch can be easily evaluated, but the result is not expressible in closed form. However, from Eqs. (6-2) and (6-3) it can be seen that C,, C„ac, and Ch are all expressible in the form
c, = C, d + c, ts
= Cms8,
Ch = Cha + ChS,
where, for example,
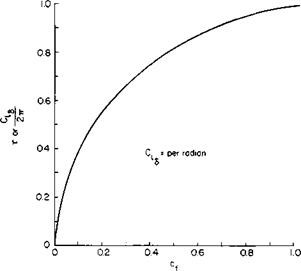
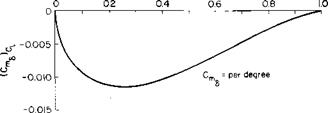
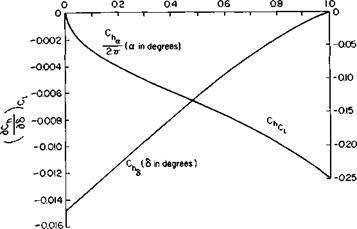
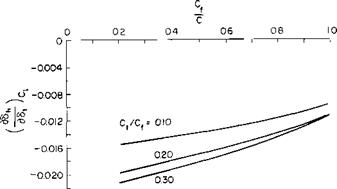
The partial derivatives in (6-9) are a function of the ratio of flap chord to airfoil chord. Theoretical values of these derivatives are presented in Figs. 6-3, 6-4, and 6-5. In addition, a derivative Chii is presented in Fig. 6-6. This
|
C Fig. 6-3. Change of lift coefficient with flap angle and chord. |
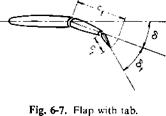
is the rate of change of hinge moment for the flap with tab deflection for the flap with a tab shown in Fig. 6-7.
The above is a linearized theory, the results of which must be used with caution. Consider first the derivative Cla. The departure of Cia from the theoretical in the physical case is so severe that the theory is rendered
|
C
Fig. 6-4. Change of moment coefficient with flap angle and chord. |
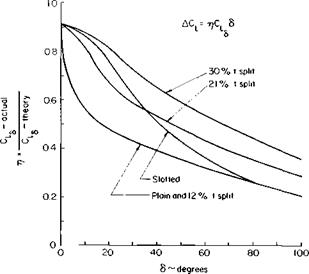
almost useless. Nevertheless, the theoretical values of Ch are used as the basis on which to predict the actual value. Based on Ref. 1, a correction to C, d is presented in Fig. 6-8, which is a function of S. Thus the theory’s primary value lies in predicting the relative effect of flap chord and not the effect of & By the use of Figs. 6-3 and 6-8 we determine the increment in C, below the stall from
AC, = r, ClaS
or, in terms of t, the flap effectiveness factor,
AC, = г]2пт5.
|
c
Fig. 6-5. Change of hinge moment with 6 and C,. |
|
Fig. 6-6. Change of hinge moment with tab deflection. |
If the airfoil were to stall at exactly the same angle of attack with the flap deflected as without, the increment in C, would also be the increment in
|
|
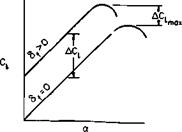
Unfortunately, this is not the case. The stalling angle may decrease as the flap angle increases so that the increment in Clmax would be less than the increment in C, in the linear portion of the lift curve. This is illustrated in Fig. 6-9. In general, at the higher Reynolds numbers (6 x 10⁶ or above).
|
Fig. 6-8. Correction to theoretical C,.. |
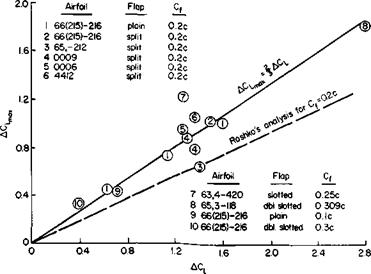
the increment in C, is only about two-thirds of the increment in C, below
‘max » *
stall. This is based on data taken from Ref. 2 for several different airfoil – flap combinations shown in Fig. 6-10.
A prediction of the increment in C/max, applicable to a thin airfoil, is presented in Ref. 3. The developments are based on the fact that stalling occurs at the nose of a thin airfoil near the suction peak on the upper surface. The boundary layer profile in the nose region depends on the location of the stagnation point. Hence at stall, for different thin airfoils, the stagnation point should have the same location for all cases relative to the suction peak.
|
Fig. 6-9. Stall performance of a flapped airfoil. |
|
Fig. 6-Ю. Increment in versus increment in C,. |
For a cambered airfoil we define otf as the ideal angle of attack in which the lift is obtained from camber alone with no suction peak on the nose. The suction peak then depends on the departure of a from a*. For a symmetrical airfoil a,- = 0. If, therefore, a symmetrical airfoil stalls at an angle of arao, a cambered airfoil would stall at an angle of am where
The angle a,- must be such that A0 from Eq. (6-2) is zero. Hence
– -£)*•
The increment in C, max would thus equal the increment AC, in C, in the linear portion of the curve due to d, minus the product of amo — am and the slope of the lift curve;
![]()
![]()
![]()
AClmax = 2(n -6, + sin ef)d – (l – °^j2n5, or, in terms of AC,,
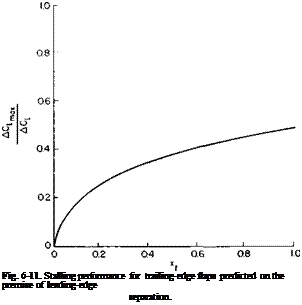
Equation (6-11) is presented graphically in Fig. 6-11. For 20% chord trailing edge flaps AC, mJAC, is about 0.48. This value is low in comparison with the data of Fig. 6-10. However, remember that the premise for Fig. 6-11 is leading-edge separation, which implies thin airfoils and low Reynolds numbers.
 |
As mentioned previously, in comparing the aerodynamic performance of
different types of flaps, we should consider the extension of the flap, if any, when deflected. Fowler flaps, for example, always exhibit much higher values of C, max than plain or split flaps. However, a large portion of the increment in C, for Fowler flaps arises from the increase in chord instead of an improvement in its stalling performance. The extensible chord is also the reason why the slope of the lift curve apparently increases with flap deflection, for C, is based on the original chord.
To emphasize the above consider Fig. 6-12 taken from Ref. 2. The lift curve presented here is for a slotted flap with a large tab. The 30% chord
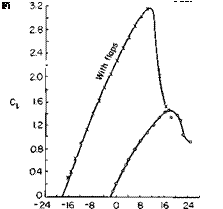 |
37°
flap angle is 37°, whereas the 10% tab is deflected an additional 30°. When deflected, the flap increases the chord by 20%. For the undeflected flap the slope of the lift curve is approximately 0.106 C,/degree with a C, max of 1.43. With the flap deflected the slope of the lift curve apparently increases to 0.125 C,/degree and C(max, to 3.10. However, based on the extended chord, these values are only 0.104 and 2.58, respectively. At a = 0, AC,, when based on the actual extended chord, is 1.7. Hence the value of AC, of 1.15 for a AC, of 1.7 from Fig. 6-10 is about what we would expect from a plain or split flap. The important point is made here that there is little significant difference in the performance of all types of unblown flaps when based on the actual chord of the airfoil with the flap extended. A survey of available
data on split, plain, slotted and double-slotted flaps has revealed the somewhat unexpected result that, when based on the extended chord at a Reynolds number of 6 x 10⁶ or higher, the maximum attainable C, is nearly the same, or approximately 2.7, regardless of flap type.
Slotting apparently offers some boundary layer control at the lower flap angles, for the curve of C, versus <5 is more linear with the slotted flap than with the plain or split flap. However, in the region of CImax the flow over the upper surface of any flap is apparently separated from the surface.
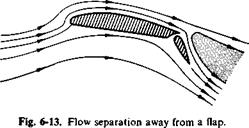 |
An interesting study of flap performance is reported in Ref. 4. Here an Army L-19 was modified and the flaps carefully faired so that tufts on their upper surfaces indicated that flow was attached. However, the measured value of Cimax was lower than would have been expected for attached flow. Subsequent observations showed that although the flow was attached at the surfaces a short distance away from the flaps the flow was separated and was not being turned by the flaps. This effect is illustrated in Fig. 6-13.
To calculate the highest C, max that could be expected from a flap system a rule of thumb value of 2.7, based on the extended chord, could be used. However, if C, max is needed as a function of 5, then Figs. 6-3, 6-8, and 6-10 should be used with the C, of the airfoil without flaps.
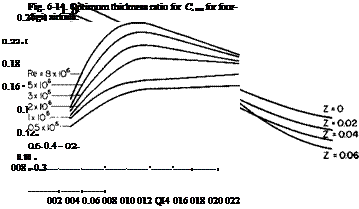
Reference 6-5 is an empirical correlation of airfoil data for four – and five-digit series NACA airfoils from which an estimate of C, max for the unflapped airfoil can be made. For an unflapped four-digit airfoil the following empirical formula is presented for C,_______________________________ for a Reynolds number of 8 x 10⁶.
t, z, and p are thickness, camber, and position of maximum camber, respectively, expressed as a fraction of the chord. Figure 6-14, taken from this reference, presents the optimum thickness ratio for Qm as a function of Reynolds number for families of four-digit airfoils with maximum camber at midchord. At the lower Reynolds numbers laminar separation occurs near the nose, so that the optimum thickness increases with decreasing Reynolds number.
The variation of Cimax with thickness ratio for NACA 24XX airfoils for various Reynolds numbers is presented in Fig. 6-15. It can be seen that below a thickness ratio of approximately 12% Clmix drops off rapidly with decreasing thickness, whereas increasing t above 0.12 has only a gradual adverse effect onС/іп>х at the higher Reynolds numbers and none at the lower values of R.
 |
Consider now the prediction of C, max at a high Reynolds number for a
Fig. 6-15. Variation of C, m„ with thickness ratio of NACA 2400 airfoils for various Reynolds
numbers.
25% chord, extensible slotted flap at a S of 80° on a 15% thick airfoil with 4% camber at the 40% chord location.
From Eq. (6-12) for the airfoil with no flaps
From Fig. 6-3
t = 0.52
From Fig. 6-8
tj = 0.26.
Therefore
A С, = 0.26(2яХ0.52) —
= 1.185
From Fig. 6-10, AC, m.x = f(1.185) = 0.79, C, m>x = 2.52 based on extended chord, or C;max = 3.15 based on original chord.
The effect of thickness and flap-chord ratio on C, m>x is shown in Fig. 6-16 for 23000 airfoils with split flaps. From this figure several observations can be made. First, a flap chord of at least 30% to probably no more than 50% is optimum for the highest C, max. The greater the thickness ratio of the section, the greater the flap chord ratio should be. The flap angle for maximum CL decreases with increasing flap-chord ratio and increasing airfoil thickness ratio.
Trim Lift Coefficient
Deflecting a flap effectively changes the camber of an airfoil, hence changes its moment about its aerodynamic center. This moment change, for a positive flap deflection, is a nose-down one that requires a download on the tail of the aircraft for longitudinal trim. Hence part of the increased lift afforded by the flap must support the download of the tail so that not all of the AC, max can be used to support the weight of the aircraft. Referring to Fig. 6-17, defining lift increments and moment increments positively upward and nose upward, respectively, gives
AL (effective) = AL + ALT,
|
|
|
Fig 6-16. Split-flap data 230xx airfoils Re = 4 x 10⁶. |
Hence
ACim„ (effective) = AC(max Гі + у д^-1- (6-13)
Because ACM/AC, max is negative, the effective value of AClmax is less than the wing AC, max. The difference resulting from the tail download required
|
Fig. 6-17. Longitudinal trim force and moment increments. |
for trim is usually an appreciable portion of the weight of the aircraft and must be considered for most configurations.


