Wing Drag
The finite wing has an induced drag even in an inviscid flow because the drag is caused by the trailing-vortex sheet. In a viscous flow, there also is a drag on the wing due to the presence of viscosity. This drag is termed profile drag and represents the sum of the drag due to friction on the wing surface and the form drag due to separation of the boundary layer on the airfoil. (An extreme example of the drag due to separation is found in the case of a two-dimensional cylinder.) Even at a small angle of attack, there is some separation over the surface of a wing near the trailing edge. The drag coefficient for a wing then is written properly as:
The value of the viscous-drag coefficient for the finite wing can be found from experimental two-dimensional airfoil data (see Chapter 5) or numerically by using strip theory in (see Section 6.5). This two-dimensional viscous-drag information may be used directly in Eq. 6.56 if the two-dimensional drag coefficient is perceived as based on a mean chord defined by the wing geometry as:
![]() _ AR
_ AR
C" b ‘
 |
||
Then, if the profile drag per unit span, D’visc, is assumed to be essentially constant across the span:
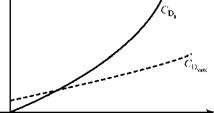
An important device for representing the aerodynamic performance of a wing is the drag polar. This is simply a plot of the drag coefficient versus the lift coefficient, as shown schematically in Fig. 6.18. The dashed curve represents the part of the drag due to the pressure distribution and viscous effects (usually called the profile drag). This part of the drag changes slowly as lift coefficient (and, hence, the angle of attack) increases. Notice that the induced drag increases rapidly with lift coefficient. At low flight speeds (requiring a high lift coefficient), the induced drag is the dominant part. Thus, it is important in an efficient design to keep the induced drag as small as possible. Recall that a parameter that strongly influences the magnitude of the induced drag is the AR of the wing planform. These effects are evaluated in detail in Chapter 9 for actual airplane configurations.
CD
 Figure 6.18. Drag polar for profile and induced drag.
Example 6.3 Given: Consider a wing with a rectangular planform. The wing is untwisted and of constant section, with a lift-curve slope correction factor of t = 0.05. The wing span is 16 ft. and the chord is 2 ft. The measured profile-drag coefficient of the wing section is 0.005, the angle of zero lift of the section is -1.3°, and the section lift-curve slope is assumed to be 2n/radian.
The wing is to be tested in a wind tunnel at a geometric angle of attack of 7° at a test-section dynamic pressure of 1.5 psia.
Required: Find
(a) lift-curve slope of the wing, per degree
(b) lift coefficient of the wing
(c) lift force on the wing during test (lbs)
(d) drag coefficient of the wing
(e) approximate magnitude of the downwash
Approach: Use the various equations in this chapter, as appropriate.
Solution: Either the value of m must be converted to “per degree” at the end or m0 must be used as “per degree” at the outset. The latter choice is not as convenient but is used here to emphasize a point. Thus, m0 = 2n/radian = (2n)/ (180/n) = 0.1096/degree. As a further preliminary, AR = b2/S = b2/(b)(c) = b/c for a rectangular wing; hence, AR = 16/2 = 8 for this wing.
(a) Using Eq. 6.45:
![]() ______ mo________________ 0.1096_____
______ mo________________ 0.1096_____
. m0(180 / n)(1 + t) _ 1 + (0.1096)(57.3)(1.05)
+ nAR + n(8)
(b) CL = m(a – aL0) = (0.087)[7 – (-1.3)] = 0.72.
(c) L = CL q„ S = (0.72)(1.5)(144)[(16)(2)] = 4,978 lbf.
(d) CDt = CDvisc + CL2/enAR = 0.005 +(0.72)2/(0.95)(8)n = 0.0267.
(e) The downwash may be estimated by using Eq. 6.43, valid for elliptical loading. Substituting w/V„ = tan(1.3°) = 1.3° _ 0.0227 radian, so that the downwash is 2.3 percent of the freestream velocity.
Appraisal: (a) Notice that with the choice of m0 in units of “per degree,” the numerator of Eq. 6.45 is expressed in “per degree,” which makes the answer for m as “per degree.” The ratio in the denominator of Eq. 6.45 must be dimensionless, so the value of m0 /radian must be used in the denominator.
(b) The magnitude of CL is reasonable and it is positive.
(c) Dynamic pressure must be converted to lbf/ft2.
(d) This is a typical value for using only drag.
(e) The downwash and the spanwise-flow components associated with the trailing vortex sheet are comparable in magnitude. Thus, assuming the flow over the wing to be locally two-dimensional is a good assumption.
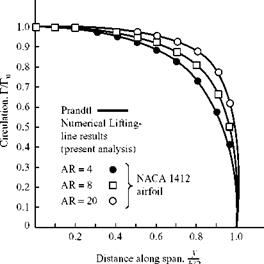
Figure 6.19 is a comparison of experimental data and prediction using lifting-line theory. The theory was validated by many experiments and gives satisfactory results if the wing AR is not too small and the wing sweep is not excessive. When properly
Figure 6.19. Comparison of lifting-line theory with experimental results (see Anderson, 1984).
 applied, lifting-line theory provides a fast and accurate method for obtaining the continuous spanwise distribution of several quantities, such as lift and induced angle of attack.
Finally, we note that moments about finite wings and the location of the wing aerodynamic center and center of pressure can be calculated as weighted averages of the wing-section properties. These topics are not discussed here.


