Measurements of Pressure Time Response
The fast time response of PSP was achieved by Baron et al. (1993) using a commercial porous silica thin-layer chromatography (TLC) plate as a binder; the observed response time of this PSP was less than 25 ns. Although this fragile PSP cannot be practically used for wind tunnel testing, Baron’s work suggest that a short response time of PSP can be obtained using a porous material as a binder. Mosharov et al. (1997) reported that the response time of anodized aluminum
(AA) PSP was in a range of 18-90 |j. s, depending on a luminophore and on some features of an anodization process. Asai et al. (2001, 2002) also measured the response time of an AA-PSP with Ru(dpp) as a luminophore using a pressure chamber with a solenoid type valve. According to Jordan et al. (1999b), a sol-gel – based PSP achieved the frequency response of as high as 6 kHz. Ponomarev and Gouterman (1998) and Scroggin et al. (1999) developed binders by mixing hard particles with polymers to increase the degree of porosity. Ponomarev and Gouterman found that increasing the number of hard particles above a critical pigment volume concentration drastically shortened the response time. Table 8.1 summarizes the response times of some PSP formulations along with their luminescent lifetimes.
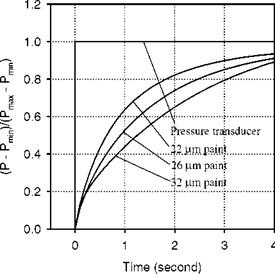
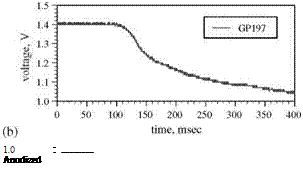
Solenoid valve type switching has been used to generate a step change in pressure for measurements of the response time of PSP by a number of researchers (Engler 1995; Carroll et al. 1995, 1996; Winslow et al. 1996; Mosharov et al. 1997; Fonov et al. 1998). Figure 8.8 shows a typical pressure jump apparatus used by Asai et al. (2002) for testing the time response of PSP. This apparatus had a small test chamber connected directly to a fast opening valve having a time constant of a few milliseconds. Sample plates used in this apparatus were typically aluminum coupons coated with PSP. Figure 8.9 shows the time response of the luminescent intensity for several PSP formulations using PtOEP as a probe molecule in binders GP197, AA, and Poly(TMSP) to a step change in pressure from vacuum to the atmospheric pressure. The pressure signal from a kulite® pressure transducer was also shown in Fig. 8.9 as a reference. The PSP based on GP197 was very slow and its time constant was in the order of seconds. Figure 8.10 shows the thickness effect on the time response of PtOEP in GP-197 to a step change of pressure (Carroll et al. 1996). In contrast, AA-PSP had the sub-millisecond time response, and Poly(TMSP)-PSP had a comparable response time to AA-PSP since Poly(TMSP) having a very large free volume is very porous. The time constant of Poly(TMSP)-PSP was about a few milliseconds. Jordan et al. (1999b) conducted frequency response experiments of sol-gel-based PSP using a speaker driver producing an oscillating pressure wave, and achieved the frequency response as high as 6 kHz. For a porphine-based PSP on a silica-gel TLC plate, Sakamura et al. (2002) utilized Cassegrain optics to detect a periodic pressure fluctuation of about 1 kHz in a chapped impinging air jet. The aforementioned measurements indicate that a high porosity is required to achieve the high time response of PSP. This viewpoint was examined by Asai et al. (2001) for a mixture of GP-197 with hard particles of BaSO4. Figure 8.11 shows the reduced response time to a step change of pressure with elevating the concentration of BaSO4 as a result of an increased porosity. Asai et al (2001) also noticed that a fast-responding porous PSP usually had lower temperature sensitivity.
![]()
|
|
|
|
|
|
|
|
|
|
|
|
|
|
|
|
 |
|
|
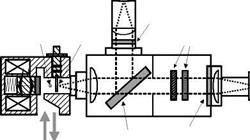
Fig. 8.9. Time response of several PSPs to a step change in pressure, (a) kulite sensor (reference), (b) GP197-PSP, (c) AA-PSP, and (d) poly(TMSP)-PSP, where PtOEP is used a probe molecule. From Asai et al. (2002)
|
Fig. 8.10. Time response of PtOEP in GP197 to a step change of pressure, depending on the paint thickness. From Carroll et al. (1996) |
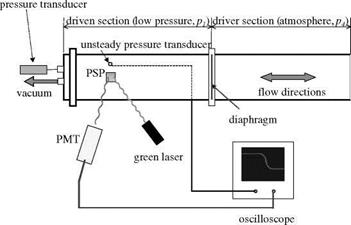
Another apparatus for creating a step pressure change is a shock tube (Sakaue et al. 2001; Teduka et al. 2000). A shock tube can generate a pressure rise in a few microseconds, and therefore it is a good device for testing a porous PSP having a response time less than a millisecond. Figure 8.12 shows a schematic of a simple shock tube for testing the time response of PSP (Sakaue et al. 2001). The shock tube had a 55×40 mm cross-section, a 428 mm long driver section, and a 485 mm long driven section. An aluminum foil diaphragm was burst by a pressure difference between the driver and driven sections, where the driver pressure was one atmospheric pressure. A pressure transducer (PCB Piezotronics model 103A11), which was connected to a 2 mm diameter pressure tap on the shock tube wall, was used to measure the unsteady reference pressure. Absolute pressures were measured using an Omega pressure transducer connected to the driven section. PSP was applied to a 25.4 mm square aluminum block flush mounted to the shock tube wall. The reference pressure transducer and PSP sample were mounted 300 mm from the diaphragm. A 532-nm laser was used as an illumination source for PSP and the laser spot size was about 2 mm on the sample surface. The luminescent emission from PSP was collected by a PMT through a long pass filter (> 570 nm) and the readout voltage from the PMT was acquired using a LeCroy oscilloscope. The response time of the PMT was about 2 |j. s. The time resolution of the apparatus was also limited by the laser spot size. The laser spot size dspot and the shock velocity us gives the limiting detectable
pressure rising time tlimit = dspot/us (about 3-5 |j. s) for this setup.
|
steady absolute
Fig. 8.12. Schematic of a simple shock tube setup for testing PSP time response. From Sakaue(1999) |
|
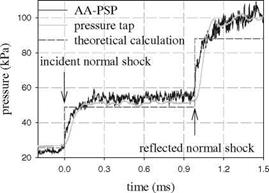
Fig. 8.13. Pressure data obtained from AA-PSP with a thickness of 9 pm and pressure transducer compared with theoretical calculation. From Sakaue (1999) |
Figure 8.13 shows typical pressure signals from a Ru(dpp) AA-PSP (9 pm thick) and the pressure transducer along with the theoretical pressure jumps associated with the incident and reflected normal shock waves. This AA-PSP was able to follow the sharp pressure rises after the incident and reflected shock waves passed through the laser-illuminated spot. Figure 8.14 shows the normalized pressure signals from the AA-PSP with different thickness values (4.3, 9.0, 13.2, and 27.2 pm). It was found that the diffusion response time of this AA-PSP
followed the power-law relation TdiJJ h0573. Figure 8.15 shows a comparison of
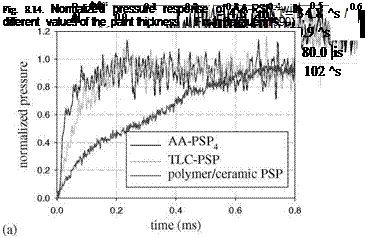 |
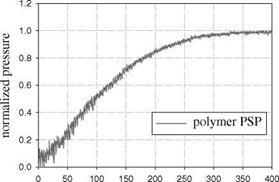
the time response of four PSP formulations to a step change of pressure. These formulations used the same probe molecule Ru(dpp) with four different binders: AA, TLC, polymer/ceramic (PC), and conventional polymer RTV. The response times of AA-PSP and TLC-PSP were in the order of ten microseconds, whereas the conventional RTV-PSP had a much longer response time (in the order of hundred milliseconds). In addition, it was found that PC-PSP had a longer response time (about 1 ms) than the thicker but more porous TLC-PSP. For a very porous PSP, the porosity of a binder had more pronounced influence on the time response of PSP than the binder thickness. This is consistent with the theoretical analysis presented in Section 8.2.
|
time (ms) Fig. 8.15. Comparison of the time response among (a) porous Ru(dpp)-based PSPs (AA – PSP, TLC-PSP, and PC-PSP) and (b) conventional polymer PSP Ru(dpp) in RTV. From Sakaue(1999) |


