Vortex Panel Method
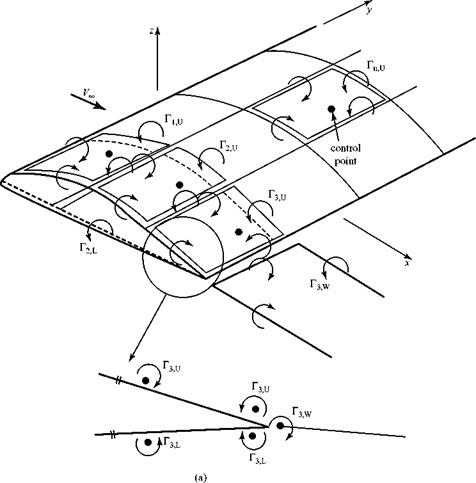
The wing top and bottom surfaces are divided into N flat quadrilateral panels. Each panel is assigned a closed vortex ring consisting of four vortex elements, each of strength Гп, as shown in Fig. 6.20a. The magnitude of the unknown rn’s is evaluated during the numerical solution. The Helmholtz theorem demands that each vortex ring be of constant strength along the length. The four sides of each vortex ring are placed just inside the four sides of the associated panels. The control point, or collocation point (i. e., the point on the panel where the tangency-boundary condition is to be applied), is located along the three-quarter chord line at the mid-span of the panel.
Regarding the Kutta condition, in general, the strengths of the transverse vortices at the wing trailing edge (e. g., the downstream elements in Fig. 6.20) are unequal and nonzero. Thus, |г3U| Ф |r3 L | Ф 0.The simplest approach is to apply the two-dimensional Kutta condition all along the trailing edge—namely, that the transverse-filament-vortex strength must be zero all along the trailing edge. To satisfy this condition, free wake panels are added to the model. Each wake panel must have a vortex-ring strength that is equal and opposite to the net strength—say, АГ3—of the two transverse vortices at the trailing-edge location from which the wake trails. Thus, for example, the Kutta condition requires that АГ3, wake = – АГ3. Something also must be stated about the wake geometry. Fig. 6.20 shows a typical wake panel extending to downstream infinity from a pair of wing trailing-edge panels. Because the wake panels cannot support any pressure difference, they must be aligned with the local flow streamlines. This streamline shape may be obtained from experiment. However, as an approximation, the wake panels may be aligned with the freestream direction, with the wing chord, or with an other convenient reference line. The wing angle


|
|
|

of attack is small, so that this type of approximation is usually satisfactory. If we desire to accommodate wake curvature, it is useful to divide each semi-infinite wake panel into several panels of arbitrary length but all with the same strength. The selfinduced distortion of the wake (i. e., wake rollup) can be included in more complicated numerical models, if desired.
The numerical solution requires that a geometric description of the problem be established before calculations can begin. Regarding a reference system, the location of each control point must be described, as well as the corner points of each vortex ring and the direction of the normal to each panel. Finally, the straight-line distance from each control point to the end points of each of the four vortex filaments, that comprise each vortex ring must be calculated and stored.
One linear-algebraic equation is written for each control point on the surface panels by applying the surface-boundary condition. This requires the calculation of the velocity induced at each control point by all of the vortex segments on all of the surface panels (including the contribution of the vortex rectangle located on the surface panel containing the control point itself) and by all of the vortex segments on all of the wake panels. Recall from Section 6.2 that each induced velocity is perpendicular to a plane containing the particular element at the vortex ring and the control point in question. Hence, the direction, as well as the magnitude, of each induced-velocity contribution is known so that a resultant velocity normal to the panel containing the control point may be established. Now, because the orientation of each surface panel relative to the freestream direction is known for any given wing and angle of attack, the normal component of freestream velocity can be found at each control point as well. The defining equation at the control point reflects the application of the no-flow through boundary condition: The normal velocity induced at the control point by all of the vortex elements on all of the surface and wake panels must be equal and opposite to the normal component of freestream velocity at that same control point.
As an example, we consider the control point on Panel 1 in Fig. 6.20a. The velocity, Vj, induced at that control point by the four vortex elements of strength Гi on Panel 1 is calculated, as in Example 6.1. The resultant is perpendicular to the Panel. The velocity induced by each of the four vortex elements on each of the remaining surface panels can be calculated using the Biot-Savart Law, as given in Eq. 6.2. Each induced velocity, Vj, is perpendicular to a plane containing the control point and the particular vortex element in question. Because the wing geometry is known, the component of Vj acting perpendicular to Panel 1—namely, Vj|s=i may be calculated. The process is repeated for each vortex element of each wake panel. When all of the calculations are made for the normal component of velocity induced at the control point on panel s = 1, the result may be represented as follows:
N 4
Vp|s=1 II (Vi|s=1)n, m + I (ViU )wake, (6.58)
n=1m=1
where VP is the resultant normal component of the velocity induced at Point P on Panel 1 by all of the N surface panels and all of the wake panels. The resultant normal component, VB then is set equal to the freestream-velocity normal component at the control point on panel s = 1 and one algebraic equation is written. Thus,
^1 V°,normal 11′
![]() The entire process is repeated for Panel 2, s = 2, and so on, until ultimately a total of N linear-algebraic equations in the form of Eq. 6.58 have been written that contain N unknowns, Г l through rN. It is apparent that there is much geometry bookkeeping to be done, which is why the method requires a computer. Usually, the Biot-Savart Law is expressed and used in a more general vector form. Also, the induced velocity and the freestream velocity may be calculated in coordinate-component form at each control point and then nulled rather than applying the boundary condition in terms of two velocity components perpendicular to the surface panel containing the control point, as illustrated herein.
The entire process is repeated for Panel 2, s = 2, and so on, until ultimately a total of N linear-algebraic equations in the form of Eq. 6.58 have been written that contain N unknowns, Г l through rN. It is apparent that there is much geometry bookkeeping to be done, which is why the method requires a computer. Usually, the Biot-Savart Law is expressed and used in a more general vector form. Also, the induced velocity and the freestream velocity may be calculated in coordinate-component form at each control point and then nulled rather than applying the boundary condition in terms of two velocity components perpendicular to the surface panel containing the control point, as illustrated herein.
Notice that a vortex element located on one side of the wing influences the flow at a control point on the opposite side of the wing. Furthermore, the appropriate distances between the two ends of the vortex element and the control point, to be used in the Biot-Savart Law, is the straight-line distance and not the distance as measured along the wing surface. The “1/r” influence of the vortex filament is still valid here and is confirmed by experiment.
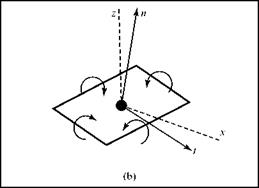
The array of simultaneous algebraic equations is solved for the unknown element strengths, Гп. The pressure distribution on the wing surface may be found in the following way, referring to Fig. 6.20b. Define an orthogonal and tangential coordinate direction at each control point. Then, use the velocity information generated when applying the no-flow-boundary condition at each control point to find the resultant velocity in the newly defined tangential-coordinate direction. Do this at every control point, accounting for the contributions due to all of the induced velocities as well as to the freestream velocity. This is the magnitude of the tangential velocity, Vn, t, at a particular control point. The local static pressure at a control point, pn, then may be found by using the Bernoulli Equation. Thus,
(6.60)
where p0 is the (known) stagnation pressure of the oncoming flow.
If we prefer, the magnitude of the local pressure coefficient at a control point may be found instead because for incompressible irrotational flow, it was shown in Chapter 4 that:
The predicted static pressure or pressure coefficient is assumed to be constant over each of the panels, n, corresponding to the n control points.
The pressure-distribution predictions from the VPM agree satisfactorily with experiments. However, unless numerous panels are used to represent the wing, the chordwise pressure distribution on the wing surface is not sufficiently detailed (or is too bumpy) to be used as input to a boundary-layer program. This is the motivation for the strip-theory approach, which is described later.
The pressure acting at the control point of each surface panel acts normal to the panel and inward on the panel surface. As noted previously, this pressure is assumed
to be constant over the panel. Thus, there is a force acting normal to and on the surface of the nth panel, which is given by:
ATn = (pn)(AAn), (6.62)
where AAn is the surface area of the nth panel and there are n = N panels.
Finally, the total lift force on the wing can be determined by first finding the component of AFn, which is perpendicular to the freestream direction (i. e., the panel contribution to lift, ALn). Then, summing over all of the panels on both the top and bottom surfaces of the wing, taking care that the contribution of ALn is signed positive upward:
N
L= E [Л LJ. (6.63)
n=1
Alternately, the spanwise lift distribution may be found by summing the contribution to lift of corresponding panels on the top and bottom surfaces of a wing at a particular spanwise location. The accuracy of the VPM is enhanced as the number of panels is increased. Results from a typical panel-code solution for a finite wing are compared with experiments in Fig. 6.21. Agreement with experimental data is excellent until viscous effects begin to dominate at large angles of attack.
In the preceding discussion of the VPM and in the following discussion of the VLM, the intent is to physically describe the method in words. There are many variations of the methodology, and the prediction codes are much more efficient than the outline described here suggests. Variations in the prediction-code flow chart and in the panel-generation code, which defines the location and shape of the surface panels, can significantly affect solution accuracy and efficiency. The student is referred to the current literature and to Katz and Plotkin (1991). Panel methods circa 1985 are compared in Margason et al. (1985).


