Vortex-Shedding Noise Model
For vortex-shedding noise the far-field pressure PSD reads
and only refers to the narrow-band spectral signature. The expression looks very similar to the one of turbulence-impingement noise because the mathematical statement also relies on velocity disturbances as the origin of sound. Here Sww is the PSD of the upwash velocity w in the near wake and ly the corresponding span-wise correlation length. It must be noted that the quantity Sww refers to a disturbance field which is not homogeneous in the direction normal to the wake, therefore the definition of input data for the formulation is questionable. The obvious choice is taking the information
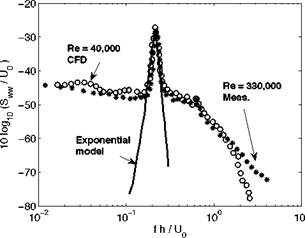
on the wake center-line where it is at its maximum. Moreover the formation of von Karman vortices at the back edge of a body requires a finite stream – wise distance which influences the induced loads. The situation is clear in the case of a rectangular trailing-edge for which the flow detaches from the corners, taken below as example. Two sets of data obtained from different methods and referring to different Reynolds numbers of the flow over a flat plate a zero incidence are compared in Fig. 17. The power spectral density of the upswash is evaluated at twice the plate thickness h downstream and assumed representative of the forcing quantity. It is deduced from incompressible LES performed over a limited span-wise extent for the low-Reynolds number case, and directly measured by hot-wire anemometry in the large-Reynolds number case. For the latter a slight frequency shift has been applied to account for some confinement effect in the experiment. A very good collapse is obtained by plotting the reduced PSD Sww/U0 as a function of the Strouhal number fh/U0. This allows proposing a model exponential fit in logarithmic frequency scale, to be used as input data.
|
Figure 17. Upwash velocity spectra in the near wake of a flat plate as predicted by LES at low Reh of 4,000 (from Roger et al (2006)) and as measured at high Reh of 330,000 (unpublished ECL data, French Program SAMBA). |
The associated correlation length has been assessed in the experiment from wall-pressure measurements closely upstream of the trailing edge, assuming that it is the same here and in the near wake by virtue of the continuity of the flow. It is quite large at the vortex-shedding frequency and drops rapidly besides. A consistent model fitted on measured data for the coherence has been found as
— е-(С/Ло)2 e — aы— w°|
where a is some constant, around 0.012/(2n) at the Reynolds number of
4.0 based on the trailing-edge thickness. The corresponding correlation length reads £y (w) = J n/2A(w), with Л = Ao e-a|ш-ш°і and Ao — 7 h.
Because the scaling of Fig. 17 is perfect with regard to the differences of dimensional parameters, it is considered reliable. However it holds only for zero angle of attack and a rectangular trailing edge. Other shapes such as beveled edges would possibly exhibit different features.


