Our heavyweight helicopter equal in the world does not have
In Rostov started production of the most load-lifting rotary-wing car The Russian holding «Helicopt[...]

Everything about aircrafts and helicopters. News and events in aviation worldwide. Civil, transportation, military helicopters and airplanes.

Everything about aircrafts and helicopters. News and events in aviation worldwide. Civil, transportation, military helicopters and airplanes.

Everything about aircrafts and helicopters. News and events in aviation worldwide. Civil, transportation, military helicopters and airplanes.

Everything about aircrafts and helicopters. News and events in aviation worldwide. Civil, transportation, military helicopters and airplanes.


So far, all the discussions of this chapter have been based on the assumption of inviscid flow of an incompressible fluid. Now, a few data will be given on the effect of viscosity and the control of the boundary layer close to the wall. The effect of compressibility on the aerodynamic coefficients of a wing profile will be treated in detail in Chapter 4.
2- 5-1 Effect of Reynolds Number on Lift
The most important quantity characterizing viscosity effects is the Reynolds number [Eq. (1-17)]. For a given profile geometry, this nondimensional quantity determines decisively the aerodynamic coefficients of a wing.
The great importance of the Reynolds number as well as of turbulence on the profile performance is demonstrated in the summary report of Schlichting [52].
The authors are indebted to K. O. Arnold, who contributed considerably to this section in the original German version of the book.
Investigations on wing profiles in the critical Reynolds number range are reported by Kraemer [34].
First, the influence of the Reynolds number on the lift and its interplay with the geometric profile parameters will be discussed. Then, some information on the profile drag will be given that, as was pointed out earlier, cannot be determined with the theory of inviscid fluids.
The Reynolds numbers of the wings that are of interest in modern aeronautics are of the order of Re = Uooc/v= 106 to 5 • 107, except for model airplanes and certain glider planes for which they lie between 10s <Re<106. In the former Reynolds number range, the boundary layer on conventional profiles is turbulent over most of its length. This is not true, of course, for so-called laminar profiles. In the range of Reynolds numbers of Re> 106, but even down to Re = 10s, the lift as computed from potential theory is in satisfactory agreement with experimental results when the angle of attack is small to moderately large. This fact can be seen, for example, in Fig. 2-10 for the inclined flat plate and for the profile Go 445 at Re — 4 • 10s, and in Fig. 2-17 for the Joukowsky profile at Re= 10s. In these cases the flow is attached to the wing; that is, no boundary-layer separation occurs. Likewise, the pressure distributions on the profile, determined from potential theory, agree well with experiments in this range of angles of attack and Reynolds numbers; see Fig. 2-18 for a Joukowsky profile, Fig. 2-33 for a symmetric NACA profile at zero angle of attack, and Fig. 2-35 for a cambered NACA profile with angle of attack.
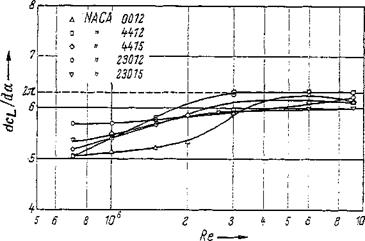
Lift slope For the profile NACA 2412, Fig. 2-39 gives the lift coefficient Ci against the angle of attack a from Jacobs and Sherman [29]. Figure 2-39a shows that for the range from Re= 8 • 104 to 3 • 106, no important effect of Reynolds number on the lift can be expected as long as the profile is not too much inclined (a < 8°). Since the cL{a) curve is linear in this a range, the Reynolds number influence can be described simply by the lift slope dci/da. This kind of presentation is used in Fig. 2-40 for a few four – and five-digit NACA profiles. These measurements show a slight increase of the lift slope dcL/da with the Reynolds number for Re < 3 • 106; beyond this Reynolds number, up to Re — 107, practically no change occurs.
In addition, the lift slope depends on both the profile thickness and the trailing-edge angle. It decreases with increasing thickness ratio tfc in the four – and five-digit NACA profiles, whereas the opposite behavior is found in the NACA 6- series, namely, an increase of dc^Ida with increasing thickness ratio t/c.
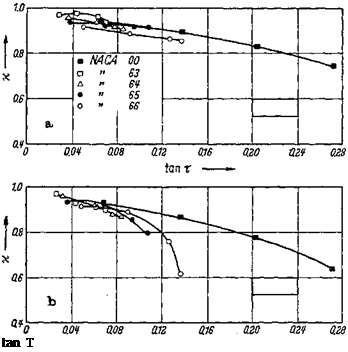
Conversely, increasing the trailing-edge angle always results in a reduction of the lift slope. The quotient к = (dcLjda)expl(dcLlda)theoT is plotted in Fig. 241 as a function of the trailing-edge semiangle т (see Fig. 2-lb). The quotient x goes to 1 when the trailing-edge angle approaches zero (V = 0). When т increases, the quotient x declines to about 0.8 for smooth surfaces, and to 0.7 for rough surfaces (see also Hoemer and Borst [25]). The deviations of the measured lift slopes from the theoretical values are caused by the boundary layer and the wake near the trailing edge.
The difference in boundary-layer thickness on the upper and the lower profile surfaces—thicker above, thinner below—is equivalent to an additional negative
camber; compare also Pinkerton [44]. The boundary layers change the Kutta condition, too, in that the rear stagnation point shifts from the trailing edge to the profile upper surface.
At extremely small profile Reynolds numbers, Re < 10s, such as occur in free-flight airplane models (see Schmitz [57]), often no linear relationship exists between lift coefficient cL and angle of attack a, even for very small angles of attack. In this case the measured cL values deviate strongly from theory over the whole angle-of-attack range, because the flow is widely separated from the profile. Conversely, at larger Reynolds numbers, Re > 10s, the separation that is caused by
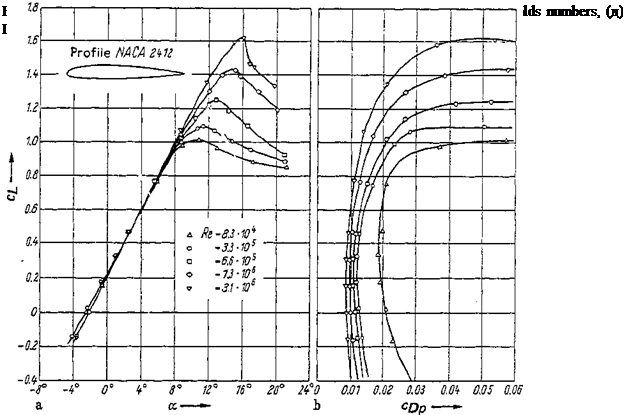 |
Figure 2-40 Reynolds number influence on lift slope dci/da for four – and five-digit NACA profiles with smooth surfaces.
Figure 2-41 Comparison of the lift slope from theory and experiment for NACA profiles of various trailing-edge angles 2r, where * = (rfc£,/ria)exp/ (cfc^/rfoOtheor – (fl) Smooth surface, (b) Rough surface.
 a steep pressure rise on the suction side of the profile occurs only at larger angles of incidence, a= 5-20°, depending on the profile shape. The lower value of a is valid for thin profiles. As soon as local separation occurs on the wing, the lift slope decreases. The deviation from the linear characteristic of the theory grows larger with an extention of the range of separated flow on the profile until finally, at large a, the flow is almost entirely separated on the suction side, and the lift drops, as demonstrated in Fig. 2-116. The phenomenon of separation from the wing, which is to be discussed later in detail, has a decisive effect on the maximum lift coefficient CL max • This coefficient is of great aeronautical importance (in take-off and landing).
Maximum lift The aerodynamic problems of maximum lift are summarized by, among others, Nonweiler [43], Schlichting [54], and Smith [60]. The maximum lift of a profile depends decisively on the flow conditions in the boundary layer on the suction side. At very small Reynolds numbers, the boundary layer is completely laminar and separation occurs near the profile nose (leading-edge stall) because of the strong pressure rise on the suction side immediately downstream of the leading edge. The location of the separation point is almost independent of the Reynolds number. The maximum lift is, therefore, independent of the Reynolds number in this range. Only at a certain larger Reynolds number, the value of which depends on the profile geometry, do the flow characteristics change. The laminar boundary layer still separates; transition to turbulent flow now takes place in the separated flow, however, leading, in general, to reattachment of the turbulent boundary layer farther downstream. In this way, a laminar separation bubble forms between the points of laminar separation and turbulent reattachment. The reattachment point moves upstream with increasing Reynolds number until it finally reaches the separation point, that is, until the length of the separation bubble becomes zero. The maximum lift increases strongly with Reynolds number as a result of the
superposition of two effects: In the first place, lift is gained at a fixed angle of attack because of the reduction of the separation length, and then the wing can be set at a higher angle of attack before the flow ultimately separates.
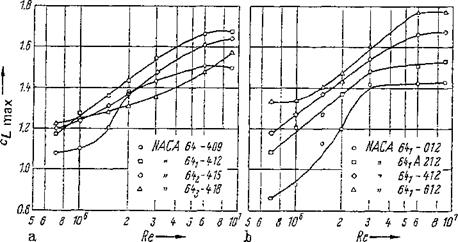
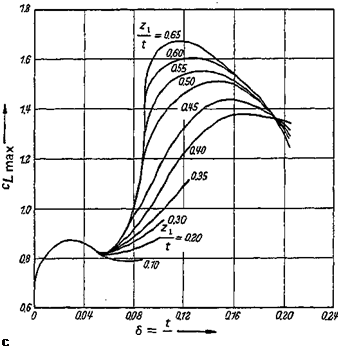
At very high Reynolds numbers, a natural transition from the laminar to the turbulent boundary layer occurs before the point of laminar separation. This transition point travels upstream with increasing Reynolds number and the length of the turbulent boundary layer, and consequently the boundary-layer thickness increases. As a result of this process, the circulation around the profile is diminished; that is, the maximum lift may again decrease somewhat at high Reynolds numbers. As an example for the cirnax behavior, the maximum lift of profiles of the NACA 6-series is plotted in Fig. 2-42 against Reynolds number for various thickness ratios t/c and camber heights hjc according to Loftin and Smith [29]; see also Fig. 2-39. In the range Re> 106 of interest to aeronautics, profiles of moderate thickness (t/c ~ 0.12) produce the largest lift. The influence of camber is reflected in an increase of cLmax with hjc because the critical, separation promoting pressure rise on the profile suction side is occurring at larger angles of attack for increased h/c. The most important geometric parameter affecting separation at large angles of attack, and thus affecting the maximum lift, is the shape of the profile nose, because this shape determines decisively the pressure distribution in the vicinity of the leading edge. The measurements by Nonweiler [43] of Fig. 2-43 convey some insight into these relationships through curves that show с^г max values for a fixed Reynolds number (Re = 6 * 106) as a function of the thickness ratio t/c. The nose radius is characterized by the profile ordinate zx at x = 0.05c. Accordingly, the nose radius has no effect on C£raax for very thin profiles, whereas for profiles of moderate thickness, cLmax increases considerably with zv It.
A similar parameter, namely, the ordinate z0/c of the profile suction side at station x/c — 0.0125, has been used by Gault [77]. It allows delineation of ranges of the various separation processes as a function of Reynolds number in a universal diagram. This presentation, Fig. 2-44, is based on measurements on about 150
|
Figure 242 Maximum lift coefficient of profiles of the NAC’A б-series vs. Reynolds number, (a) Effect of thickness ratio. (b) Effect of camber ratio. |
Figure 2-43 Maximum lift coefficient at Reynolds number Re = 6 • 106 vs. thickness ratio t/c and nose radius in terms of zl/t. zx=z (x/c = 0.05). After [43],
 profiles with smooth surfaces at low wind-tunnel turbulence. It shows that profiles with sharp leading edges, or with very small nose radii (z0/c < 0.009), have, at all Reynolds numbers, a specific separation characteristic that is termed thin-airfoil stall. Even at small angles of attack a, separation of the flow over the thin leading edge occurs directly at the profile nose, followed by reattachment. The velocity profile of the boundary layer at the point of reattachment is neither typically laminar nor typically turbulent. Not before the boundary layer approaches the trailing edge is a fully turbulent flow pattern established (see McCullough and Gault [77]). Reattachment occurs more and more downstream when the angle of attack increases, leading to a growing separation range and consequently a gradually diminishing lift slope. As soon as the flow is detached on the whole suction side, cL decreases continuously with increasing a (see also Young and Squire [77]).
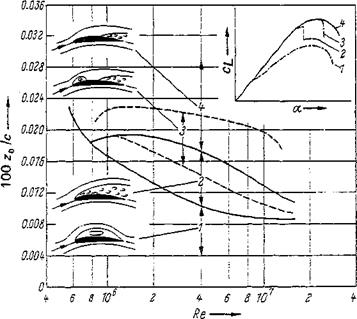 Figure 2-44 Separation from profiles vs. Reynolds number and nose radius [in terms of z0/c, with z0 = z (x/c = 0.0125)], after [77]. (1) Separation from a thin profile. (2) Laminar separation from profile nose. (3) Combination of laminar and turbulent separation. (4) Turbulent separation.
A basically different separation characteristic is found on wings of moderate thickness having a moderately large nose radius, the leading-edge curvature of which is, however, still relatively large.[10] The steep pressure rise behind the profile nose then leads to separation of the laminar boundary layer at larger angles of attack. The transition to turbulent flow takes place, however, in the separated flow that results in reattachment farther downstream. A laminar separation bubble is formed, the extent of which decreases with increasing angle of attack because the transition point, and with it the turbulent reattachment point, move closer to the separation point, which moves likewise toward the leading edge. Eventually, the laminar boundary layer separates on the very nose where the contour curvature is too large for the transition to cause reattachment. This process, known as the leading-edge stall, is characterized by a sudden sharp lift drop (see Crabtree [11] and Tani [64]).
On the other hand, on most thick profiles (f/c>0.15), that is, at large nose radii, flow reattachment occurs behind the laminar separation point, even at large angles of attack. In this case the maximum lift is determined by two processes that influence each other. These are the expansion of the laminar separation bubble from the nose, and the turbulent separation that starts at the trading edge and moves upstream with increasing angle of attack (combined leading-edge and trailing-edge stall). The variation of the lift ci{a) depends on the predominance of one or the other of these two separation processes. The separation bubble may disappear entirely on very thick, strongly cambered profiles and at very high Reynolds numbers. The reason for this is that the Reynolds number is then large enough for a natural transition to turbulent flow upstream of the station of strong pressure rise. The turbulent boundary layer separates only a short distance upstream of the trailing edge (trailing-edge stall). This separation point moves upstream continuously with growing angle of attack, and the lift does not drop abruptly after passing Cl max hut very gradually, similarly to the case of the thin profile. The profile shape of optimum lift coefficient at flow without separation can be computed following a procedure of Liebeck [38].
Pressure distribution In Fig. 245, pressure distributions on profiles of the NACA 6- series are presented in the range of the maximum lift at a Reynolds number Re = 5.8 * 106 according to McCullough and Gault [77]. Separation from thin profiles (NACA 64A006) is characterized by a very slight underpressure near the leading edge. This underpressure is even reduced with an a increase, whereas the separation range (cp = const) grows from the profile nose downstream. Conversely, a very strong suction peak exists on profiles of larger thickness ratio for a <<4?£max- ^he laminar separation bubble is too short to be noticeable in the pressure distribution, if it exists at all. The NACA 63i-012 profile causes laminar separation at the nose, resulting in an abrupt collapse of the high underpressure on
Figure 2-45 Measured pressure distribution at Reynolds number Re — 5.8 • 10e on profiles of NACA 6-series with various separation characteristics in the range of maximum lift. (1) Separation from thin profile. (2) Laminar separation from profile nose. (3) Turbulent separation.
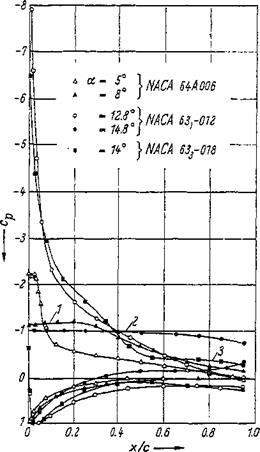 the leading edge and an immediate flow separation over the entire suction side. This in turn results in the steep lift drop when the angle of attack for Cjr, max is exceeded. As soon as turbulent separation has been established, as is the case on the NACA 6З3-ОІ8 profile, the suction peak at the leading edge remains, even when a is larger than aCLmax- The separated range expands from the trading edge farther and farther upstream, causing the lift to decrease continuously.
The separation characteristics of a given profile may be different for the various Reynolds numbers, as shown in Fig. 246 for the example of the pressure distribution on the profile NACA 4412 at the angle of attack a = 16° (see Pinkerton [29]). For Re = 1 • 10s and 4.5 • 10s, the pressure distribution is similar to that of the profile NACA 64A006 (Fig. 245); that is, separation has the same character on thin profiles, although only at larger angles of attack. The separated range decreases with increasing Reynolds number in this case. According to Fig. 244, for the thin profile at Re< 106, there are only two possibilities, namely, laminar separation or turbulent separation near the trailing edge. Transition from one behavior to the other requires that the profile is made thicker when the Reynolds number is reduced. When the Reynolds number is raised to 1.8 • 106, a laminar separation bubble 0.005c long forms on the NACA 4412 profile, and at x/c = 0A0 turbulent separation sets in. Finally, at Re = 8.2* 106, the flow is attached over the whole profile. A further increase in Reynolds number has practically no influence on the pressure distribution, which agrees quite well with theory as long as no separation occurs (see Cooke and Brebner [10]). Note,
Figure 2-46 Effect of Reynolds number on pressure distribution on profile NA. CA 4412 at a large angle of attack (a= 16°).
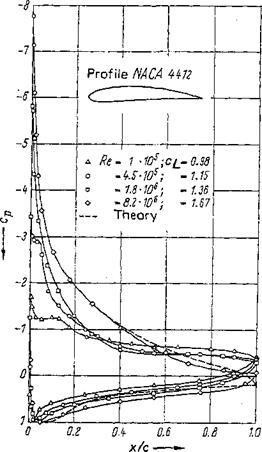 however, that the theoretical curve of Fig. 2-46 is obtained from a modified theory from Pinkerton [44] and not from pure potential theory.
![Подпись: Figure 2-47 Change of pressure distribution on a wing profile with angle of attack [67]. {a) Attached flow, medium angle of attack. (b) Beginning of separation from trailing edge CL = cLmax- (c) Separation from leading edge with enclosed vortex (bubble).](/img/3131/image251_1.png) |
The influence of the boundary layer on the pressure distribution on a profile as a function of angle of attack is presented in Fig. 2-47. Figure 2-47д gives the distribution at moderate angles, which is susceptible of computation after the
methods of potential theory. At larger angles of attack, separation sets in first on the upper surface of the profile near the trailing edge (Fig. 247b). From there, it travels upstream with increasing angle of attack. At the same time a wake forms in which a vortex (bubble) is embedded. At very large angles of attack, beyond the maximum of the lift coefficient, the wake shifts upstream to the wing nose (Fig. 247c). The flow reattaches again further downstream.
A comprehensive listing of experimental data on the lift problem is found in Hoerner and Borst [25].
Based on studies of Preston [61], Spence [61] makes some recommendations about the theoretical inclusion of the friction effect into the aerodynamics of the wing profile. Theoretical determination of the pressure distribution for separated incompressible flow about profiles of almost any shape is possible using a computational method of Jacob [27], but the abrupt leading edge separation and reattachment of the flow cannot be obtained directly by this method.