Propeller Analysis
It is assumed that the propeller is far enough ahead of the wing to neglect the velocities induced there by the wing. If this is not the case, correction of the propeller angle of attack can be made for the upwash ahead of the wing. Figure 8-2 shows a propeller at an angle of attack.
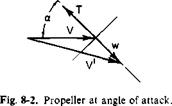 |
At the plane of the disk a velocity w is induced, given, according to Glauert’s hypothesis, by
T = 2pAV’w, (8-1)
where
V = [(F cos a + и’)2 + (F sin a)2]1/2.
This leads to a quartic in w:
w4 + w32V cos a + w2V2 = • (8-2)
This equation can be nondimensionalized in terms of F. However, it leads to difficulties in the hovering or static thrusting case in which F is zero. Instead, the induced velocity which would be induced statically for the same thrust is used as the reference velocity.
This velocity, given in Chapter 4, is
T 1/2
Hence (8-2) can be written as
![]() w4 ,/wY У
w4 ,/wY У
— ) +21— 1 —cos a +
W n / VWn / W n
 |
|
The ideal power required by the propeller is given by the product of the thrust and the velocity normal to the disk.
P0 = Tw0
= power required to produce T statically.
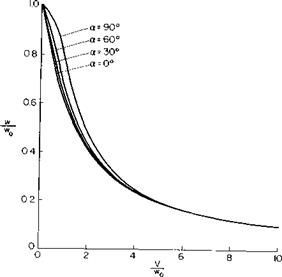
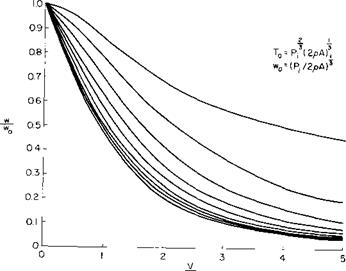
Equations (8-3) and (8-5) have been solved numerically for w/w0 and Pj/P0 as a function of V/w0 and a and their solutions are presented in Figs. 8-3 and 8-4. These curves represent the variation of w and P, for a constant thrust at a fixed angle of attack. Notice that w/w0, the ratio of the induced power for the general case to the induced power in hover, decreases for all angles of attack with increasing forward velocity but decreases more rapidly, the lower the angle of attack.
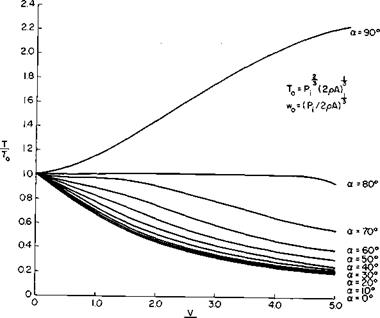
These relations can also be manipulated to give the variation of w and T with forward velocity for a constant power. From (8-4), for P, constant,
![]() (8-6)
(8-6)
where from Chapter 4
T0 = Pfl3(2pA)113,
 ЧІ/3
ЧІ/3
^0
![]() (—Y + 2(—Y+co.. + (—Y(—Y – ©
(—Y + 2(—Y+co.. + (—Y(—Y – ©
WqJ woJ w0 w0; w0J t0j or
![]()
|
|
|
|||
|
|||||
|
|||||
![]()
|
|
|
|
|
|
|
|
|
|
|
|
|
|
|
|
|
|
|
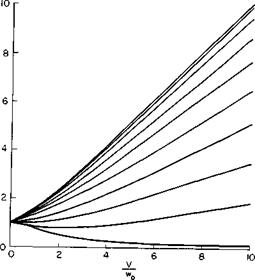
These relations have been solved numerically for w’/h’0 and T/T0 as a function of V/и’0 for various a. The results are presented in Figs. 8-5 and 8-6. Notice that for a constant power the thrust decreases with forward speed for a = 0, that is, as a propeller, and increases with forward speed for a = 90°, that is, when acting as a rotor. It is interesting to note that for an a of 80° the thrust is nearly constant with speed.
These curves would be utilized as follows: suppose we wished to calculate the power to produce a given thrust at a given a and V. First we would calculate w0 to obtain V/w0 and P0. Then, from Fig. 8-4, P/P0, hence P, would be obtained.
The power according to (8-5) is ideal in that it includes neither tip losses nor profile power. It might be expected that the tip losses would be accounted for fairly well if P0 were calculated by vortex theory rather than by simple momentum principles.
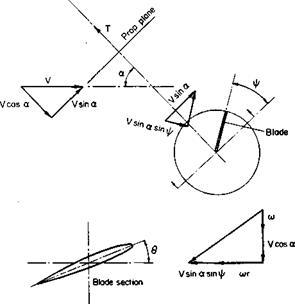
The profile power is calculated in a manner similar to that for a rotor in forward flight. Figure 8-7 illustrates the velocity components under which a blade section is operating when the propeller is operating at an angle of attack. If the section Cd is assumed constant along the blade, then
^-[1 +(„зт«)Ч^С„
or
![]() Cp = Cpo(l + /і’2),
Cp = Cpo(l + /і’2),
where p’ = p sin a,
P = V/VT,
CP0 = CP for P = 0-
The addition to the parasite power resulting from drag of the blades is again similar to the rotor.
= 2P’2Cro (8-9)
In Ref. 1 data are given on a wing and propellers in combination and separately at angle of attack from zero to 90°. Here still another thrust coefficient is defined, namely,
|
|
|
|
|
|
|
|
|
|
Because T/A = 2pw%, T" can be written as
T‘= 4 + (K/h-0)2
or
![]()
![]()
![]() (8-11)
(8-11)
The ratio of the power required for a given V and T to the ideal power required for V = 0 can be written in terms of CT and Cp as
where Cp and CT are defined according to 4-51(a) and (c).
In order to compare the data of Ref. 1 with Fig. 8-4, the profile power must be subtracted from the measured Cp values. For comparison purposes it is assumed simply that Cd is a constant, independent of r and V, and that V ^ 0. Thus the profile power coefficient becomes approximately
For the propeller in Ref. 1 CPp was estimated to be 0.004, which corresponds to a Cd of approximately 0.016.
The following table illustrates the reduction of the data from Ref. 1; Fig. 9 of that reference is used.
Table 8-1 shows that the method of presentation of the data of Ref. 1 is
|
Table 8-1 Reduction of Data of Ref. 1
|
|
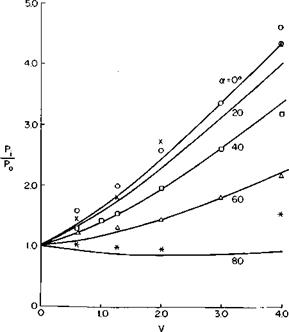
Fig. 8-8. Variation of power with forward speed for tilting propeller. Experiment: a = 0 O; 30 x ; 40 □; 60 Л: 80*. |
misleading. We might think that the power required for a constant T" increases as a increases, since Cp increases. Actually, however, the power required at 80° is only about one-third of that required at 0°.
Figure 8-8 compares the data of Ref. 1 with predictions based on the foregoing analysis. The data appear to confirm the analytical predictions.


