Trailing-Edge Noise Results
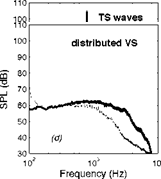
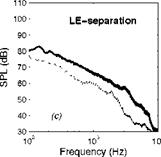
Trailing-edge noise results for an industrial Controlled-Diffusion (CD) airfoil tested at low-Mach number are presented and discussed in this section as illustration of the methodology. The experimental protocol is the same as for turbulence-impingement noise. The airfoil is instrumented by clustered remote-microphone probes so that the wall-pressure statistics (Фрр and £y) close to the trailing edge is measured directly (Roger & Moreau (2004)). This provides information on the sound sources. The far-field sound is also measured in the mid-span plane. Both wall-pressure spectra and acoustic spectra are compared in Fig. 22. Different flow regimes are obtained by setting different geometrical angles of attack, all with attached and stable laminar boundary layers on the pressure side. The acoustic spectra are artificially shifted up in order to make the comparison of spectral envelopes easier.
In case (a) a laminar unstable boundary layer develops on the suction side, with the expected Tollmien-Schlichting (TS) instability waves. The main bump and its distortion harmonics feature the range of unstable frequencies. Because the unsteady motion is coherent, both source and sound spectra exhibit additional tones resulting from acoustic back-reaction. Case (b) corresponds to a turbulent boundary layer triggered by a small leading – edge separation bubble. This regime is characterized by quite high fluctuating levels at low frequencies. In case (c) the flow remains attached but the boundary layer rapidly grows upstream of the trailing edge due to the formation of large vortical patterns in the aft part of the airfoil. This regime is referred to as ’distributed vortex shedding’ by Roger & Moreau (2004). In each case the overall similarity of source and sound spectra confirms the cause-to-effect relationship. The level differences illustrate the ratio Spp/^pp and emphasize the variations of radiation efficiency with flow regime and/or frequency, essentially attributed to the span-wise correlations length £y. TS waves are the most efficient in the frequency range of the bump, because they are associated with quite large values of £y. Case (b) has the minimum efficiency, nearly frequency-independent. In contrast case (c) is more efficient below 1 kHz, because the span-wise coherence takes quite high values as reported in the reference paper.
Sound predictions in dimensional variables achieved by the analytical model of section 5.2 taking the measured wall-pressure statistics as input
 |
 |
Figure 22. Compared wall-pressure (thick lines) and far – field sound (thin dotted) spectra for a CD airfoil at different flow regimes. Sound measured in the mid-span plane, normal to chord length. (a) airfoil cross-section. (b) Tollmien – Schlichting waves (laminar boundary layer). (c) leading – edge separation. (d) distributed vortex shedding. Acoustic spectra scaled by R2/(Lc) and shifted up by 30 dB. Frequencies below the vertical dashed lines are not reliable because of background-noise issues.
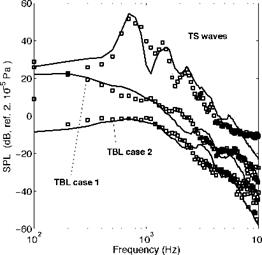
data are compared with measurements in Fig. 23, for the same three aforementioned regimes (Moreau & Roger (2009)). The upper plot refers to the onset of TS waves. The tones of Fig. 22-b resulting from amplification by acoustic feedback have been removed from the spectrum because the statistical model only addresses direct sound production from random disturbances. The remaining hump-like part corresponding to the primary
|
Figure 23. Predicted versus measured trailing-edge noise spectra of a thin cambered airfoil, from Moreau & Roger (2009). The three sets of data are vertically shifted from each other by 10 dB for clarity. |
TS wave radiation with no feedback is reproduced accurately because the span-wise coherence can be measured over an extended frequency range. The other plots are shifted by -10 dB (case 1, Fig. 22-c) and -20 dB (case 2, Fig. 22-d) for clarity. In these cases the much weaker span-wise coherence at high frequencies is not accessible. Therefore it is as far as possible deduced from the measurements and continued by fitted theoretical trends; Corcos’ model is used in case 1 and an ad hoc model proposed by Roger & Moreau (2004) is used in case 2. Bumps in the predicted spectra around 3 kHz and 5.5 kHz as well as dips around 2 kHz and 4.5 kHz are attributed to chord-wise non compactness (airfoil chord 13 cm). They do not clearly appear or they are shifted in the measurements, possibly because of camber effects and additional sound scattering by the nozzle lips in the experiment. Anyway the good overall agreement reported in Fig. 23 shows that the predictions are reliable when fed with directly measured input data. Similar results for a flat plate are found in next section.


