UNSTEADY PANEL METHODS
Principles of converting a steady-state, potential-flow solution into a time – dependent mode were summarized in Section 13.6, and were demonstrated in the sections that followed. The complexity of these examples in terms of geometry increased gradually and in the previous section the three-dimensional thin lifting-surface problem was illustrated. Although this method was capable of estimating the fluid dynamic lift, the calculation of the drag was indirect and inefficient from the computational point of view. Therefore, a similar conversion of a three-dimensional panel method into the unsteady mode can provide, first of all, the capability of treating thick and complex body shapes, and in addition the fluid dynamic loads will be obtained by a direct integration
of the pressure coefficients. Since the pressure coefficient is obtained by a local differentiation of the velocity potential (and not by summing the influence of all the panels) this approach yields an improved numerical efficiency. Also, the drag force is obtained as a component of the pressure coefficient integration and there is no need for a complicated estimation of the leading-edge suction force.
The following example is based on the conversion of a steady-state panel method based on constant-strength source and doublet elements12 11 (described in Section 12.5), which resulted in the time-dependent version,12 13 presented in this section. Also, it is recommended for the reader to be familiar with Sections 12.5, and 13.12 since some details mentioned in these sections are described here only briefly.
The method of the conversion is described schematically in Fig. 13.25, and the potential-flow solution will be included in a time-stepping loop that will start at t = 0. During each of the following time steps the strength of the latest wake row is computed by using the Kutta condition, and the previously shed wake vortex strengths will remain unchanged. Thus, at each time step, for N panels N equations will result with N unknown doublet strengths. If the geometry of the body does not change with time then the matrix is inverted only once. In a case when the body geometry does change (e. g., when a propeller rotates relative to a wing) the influence coefficients and matrix inversion are calculated at each time step. The description of the method, based on the eight step procedure, is then:
Choice of singularity element. The basic panel element used in this method has a constant-strength source and/or doublet, and the surface is also planar (but the doublet panels that are equivalent to a vortex ring can be twisted). Following the formulation of Section 9.4, the Dirichlet boundary condition on a thick body (e. g., Eq. (13.18)) can be reduced to the following form (see Eq. (12.29)):
N Nw N
2 Ckvk + 2 c, fi, + 2 Bkak = 0 (13.156)
* = 1 /=1 k = 1
which condition must hold at any moment t. This equation will be evaluated for each collocation point inside the body and the influence coefficients Ck, C, of the body and wake doublets, respectively, and Bk of the sources are calculated by the formulas of Section 10.4. (In this example only the Dirichlet boundary condition is described but with a similar treatment the Neumann condition can be applied to part or all of the panels.)
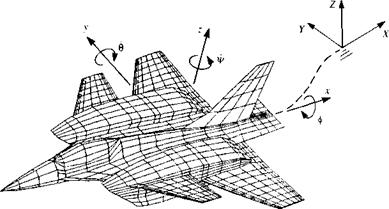
Kinematics. Let us establish an inertial frame of reference X, Y, Z, as shown in Fig. 13.39, such that this frame of reference is stationary while the airplane is moving to the left of the page. The flight path of the origin and the orientation of the x, y, z system are assumed to be known and the boundary
|
Inertial frame of reference
FIGURE 13.39 Body and inertial coordinate systems used to describe the motion of the body. |
condition (Eq. (13.13a)) on the solid surface becomes
ЭФ
-г-= (V0 + vrel + ft X r) • n (13.157)
an
The kinematic velocity components at each point in the body frame due to the motion (V0 + vte, + ft X r) are given as [t/(/), V(t), W(t)] by Eq. (13.141). If the combined source/doublet method is used (see Section 13.2) then the Dirichlet boundary condition requires that the source strength is given by Eq.
(13.19) :
о = —n • (V0 + vrel + ft X r) (13.19)
Discretization and grid generation. In this phase the geometry of the body is divided into surface panel elements (see for example Fig. 12.22) and the panel comer points, collocation points (usually slightly inside the body) and the outward normal vectors n* are identified. Also, the counter к for each panel is assigned and a typical example of generating a wing grid and the unfolded patch are shown in Fig. 12.23.
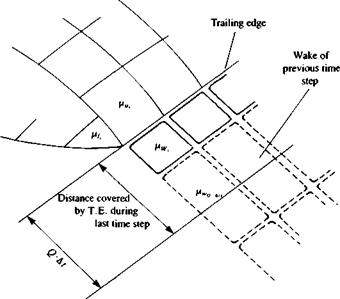
The wake shedding procedure is described schematically by Fig. 13.40. A typical trailing-edge segment is shown with momentary upper fiu and lower ju, doublet strengths. The Kutta condition requires that the vorticity at the trailing edge stays zero:
Hw, = (j*u – M,), (13.158)
Thus, the strength of the latest wake panel /uWt is directly related to the wing’s (or body’s) unknown doublets. Note that the spanwise segment (parallel to the
|
FIGURE 13.40 Schematic description of a wing’s trailing edge and the latest wake row of the unsteady wake. |
trailing edge) of the latest wake panel (which is actually equivalent to a vortex ring) is placed in the interval covered by the trailing edge during the latest time step (of length Q ■ At). Usually it must be placed closer to the trailing edge within 0.2-0.3 of the above distance (see discussion about this topic at the beginning of Section 13.8.2). During the second time step the wing trailing edge has advanced and a new wake panel row can be created using the new aft points of the trailing edge. The previous (/ – Af)th wake row will remain in its previous location (as observed in the inertial frame) so that a continuous wake sheet is formed. The wake corner points will then be moved with the local velocity, in the wake rollup calculation phase. Once the wake panel is shed, its strength is unchanged (recall the Helmholtz theorems in Section 2.9), and the wake vortex carries no aerodynamic loads (and therefore moves with the local velocity). Thus, the strengths of all the previous wake panels are known from previous time steps. This shedding procedure is repeated at each time step and a row of new trailing-edge wake vortex rings are created (wake shedding procedure).
Influence coefficients. In order to specify the time-dependent boundary condition the kinematic conditions need to be known (from Eq. (13.141)) and a time-stepping loop (shown in Fig. 13.25) is initiated with I, as the time step counter:
Let us assume that at t = 0 the two coordinate systems x, y, z and X, Y, Z in Fig. 13.39 coincided and the wing was at rest. The calculation is initiated at t = At and the wake at this moment consists of one wake panel row (the wake panel row adjacent to the trailing edge in Fig. 13.40). The Dirichlet boundary condition (Eq. (13.156)) when specified, for example, at the ith panel’s collocation point (inside the body) is influenced by all the N body and Nw wake panels and will have the form:
N Nw N
2 Cl7tju* + 2 C„ni + 2 Bik°k = 0 (13.156a)
*=i /=і л=1
But the strength of all the wake panels is related to the unknown doublet values of the trailing-edge upper and lower panels, via the Kutta condition (Eq. 13.158). Therefore, by resubstituting the trailing-edge condition (see also a similar explanation in Section 12.5), this boundary condition can be reduced to include only the body’s unknown doublets and for the first time step it becomes:
2 AuJtk + 2 B№ak = 0 t = At (13.159)
k=1
where Aik = Cik if no wake is shed from this panel and Axk = Cik ± CH if it is shedding a wake panel.
During the subsequent time steps wake panels will be shed, but as noted, their strength is known from the previous computations. Thus, Eq. (13.159) is valid only for the first time step, and for t> At the influence of these wake doublets nw (excluding the latest row) must be included in the boundary conditions. So for all the other time steps Eq. (13.156a) will have the form
N Mw N
2 Aikfik + 2 Can, + 2 Влок = 0 t> At (13.160)
*=i /=i *=i
Note that now the wake counter Mw does not include the latest wake row.
 |
|
Establish RHS vector. Since the source value is set by the value of the local kinematic velocity (Eq. (13.19)), the second and third terms in Eq. (13.160) are known at each time step and, therefore, can be transferred to the right-hand side of the equation. The RHS vector is then defined as
(Again, note that fi, w and ok are known.) In the case when the body geometry is not changing with time the bkt coefficients are calculated only once, but the ckt coefficients of the wake must be recomputed at each moment because of the wake’s time dependent rollup.
This matrix has a nonzero diagonal (akk = when the panel is not at the
trailing edge) and has a stable numerical solution.
The results of this matrix equation can be summarized in indicial form (for each collocation point к) as
If the shape of the body remains unchanged then the matrix inversion occurs only once. For time steps larger than 1 the calculation is reduced to
^ = 2>*/RHS, (13.164)
/=i
 |
where akll are the coefficients of the inverted matrix. In situations when a large number of panels are used (more than 2000) then from the computational point of view it is often more economical to iterate for a new instantaneous solution of Eq. (13.163), at each time step, than to store the large inverted matrix a*/ in the memory.
and in the normal direction
where /, m are the local tangential coordinates (see Fig. 12.25). For example, the perturbation velocity component in the / direction can be formulated (e. g., by using central differences) as
Яі = ^гЛРі+і~ Pi-i) (13.166)
2 Л/
In most cases the panels do not have equal sizes and instead of this simple formula, a more elaborate differentiation can be used. The total velocity at collocation point к is the sum of the kinematic velocity plus the perturbation velocity:
Q* = [1/(0, V(0, wm • (/, rn, n)k + (q„ qm, qn)k (13.167)
where lk, mk, nk are the local panel coordinate directions (shown in Fig. 12.25) and of course the normal velocity component for a solid surface is zero. The pressure coefficient can now be computed for each panel using Eq. (13.28):
Here Q and p are the local fluid velocity and pressure values, ЭФ/dt = Эц/dt (since Ф, = 0) and pref is the far-field reference pressure and uref can be taken as the magnitude of the kinematic velocity as appears in Eq. (13.8):
 Vref = -[Vo + ft X r]
or as the translation velocity of the origin V0. For nonlifting bodies the use of Eq. (13.28a) instead of Eq (13.168) is recommended when the body rotation axis is parallel to the direction of motion. (In the case of more complex motion the use of the pressure equation and selection of vref should be investigated more carefully.)
The contribution of an element with an area of A5* to the aerodynamic loads AF* is then
AF* = – CPkaPv2Kf)k AS* n* (13.170)
In many situations, off-body velocity field information is required too. This type of calculation can be done by using the velocity influence formulas of Chapter 10 (and the singularity distribution strengths of о and of p are known at this point).
Vortex wake rollup. Since the wake is force-free, each wake panel (or wake vortex ring) must move with the local stream velocity (Eq. (13.21a)). The local velocity is a result of the kinematic motion and the velocity components induced by the wake and body and are usually measured in the inertial frame of reference X, Y, Z, at each panel’s corner points. This velocity can be calculated (using the velocity influence formulas of Section 10.4.1 for the doublet and of Section 10.4.2 for the source panels) since the strength of all the singularity elements in the field is known at this point of the calculation.
To achieve the wake rollup, at each time step, the induced velocity (и, v, w)i at each wake panel corner point l is calculated and then the vortex elements are moved by
(Ajc, Ay, Az), = (и, v, w)t At (13.171)
Summary
The time-stepping solution is best described by the block diagram in Fig.
13.25. For cases with fixed geometry (e. g., a maneuvering airplane) the geometrical information, such as panel corner points, collocation points, and normal vectors, must be calculated first. Then the time-stepping loop begins and based on the motion kinematics the geometry of the wake panel row adjacent to the trailing edge is established. Once the geometry of the trailing edge area is known, the influence coefficients ak, of Eq. (13.62) can be calculated. Also, using the same kinematic velocity information (e. g. Eq.
(13.141) ) the body’s source strength (Eq. (13.19)) and the RHS vector of Eq. (13.161) are obtained. Next, the unknown doublet distribution is obtained and the surface velocity components and pressures are calculated. Prior to advancing to the next time step, the wake rollup procedure is performed and then the time is increased by At, the body is moved along the flight path, and the next time step is treated in a similar manner.
Some examples of using the unsteady, constant-strength singularity element based panel method of Ref. 12.13 are presented in the following paragraphs.
Example 1. Large-amplitude pitch oscillation of a NACA 0012 airfoil. The
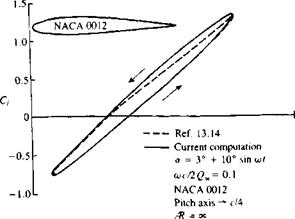
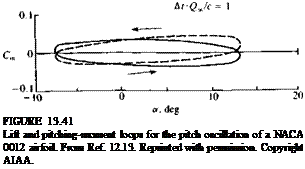
previous examples on the pitch oscillations of an airfoil were obtained by thin airfoil methods which do not provide the detailed pressure distribution on the surface. In this case the computation’s are based on a thick-airfoil model and the two-dimensional results were obtained by using a large aspect ratio (Ж = 1000) rectangular wing. The lift and pitching-moment histograms, during a fairly large-amplitude pitch oscillation cycle, of this NACA 0012 two-dimensional airfoil are presented in Fig. 13.41. Comparison is made with experimental results of Ref. 13.14 for oscillations about the airfoil’s quarter-chord. The computations are reasonably close to the experimental values of the lift coefficient through the cycle. During the pitchdown motion, however, a limited flow separation reduces the lift of the airfoil in the experimental data. The shape of the pitching-moment loop is close to the experimental result with a small clockwise rotation. This is a result of the inaccuracy of computing the airfoil’s center of pressure, since only nine chordwise panels were used.
This example indicates, too, that if the flow stays attached over the airfoil then the Kutta condition based load calculation is applicable to engineering analysis even for these large trailing edge displacements.
Example 2. Sudden acceleration of an airplane configuration. The transient load on a thin airfoil that was suddenly set into motion was first reported during
|
|
 |
 |
|
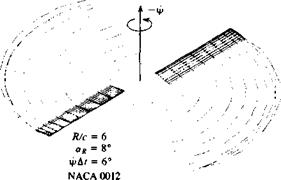
FIGURE 13.43 Panel model of a two-bladed rotor and its wake in hover, after one quarter revolution. From Ref. 12.13. Reprinted with permission. Copyright AIAA. |
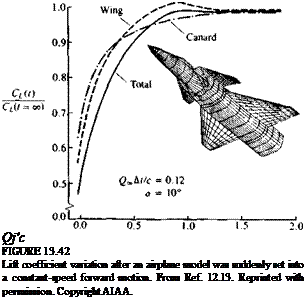
the 1920s13 2 and only recently with the use of panel methods could this type of analysis be applied to more realistic airplane configurations. Such computation for a complex aircraft shape is presented in Fig. 13.42, and the panel grid consists of 706 panels per side of the model. The transient lift growth of this wing/canard combination differs somewhat from the monotonic lift increase of a single lifting surface as presented in Fig. 13.37. At the first moment the lift of the wing and canard grow at about the same rate, with the lift of the wing being slightly lower because of the canard-induced down wash. Then the wing’s lift increases beyond its steady-state value, since the canard wake has not yet reached the wing. At about Q^t/c — 1.0 the canard wake reaches the wing and its influence begins to reduce the wing’s lift. This behavior results in lift-overshoot, as shown in the figure.
|
FIGURE 13.44 Spanwise load distribution on the rotor blades of Fig. 13.43. From Ref. 12.13. Reprinted with permission. Copyright AIAA. |
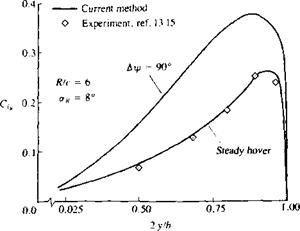
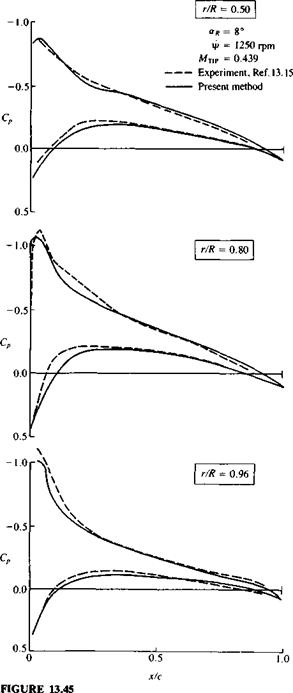
Example 3. Helicopter rotor. The flexibility of this method can be demonstrated by rotating a pair of high aspect ratio, untwisted wings around the 2 axis, to simulate rotor aerodynamics. The trailing-edge vortices behind this two-bladed rotor, which was impulsively set into motion, are presented in Fig. 13.43. Similar information on wake trajectory and rollup, for more complex rotorcraft geometries and motions (including forward flight), can easily be calculated by this technique. The spanwise lift distribution on one rotor blade of Fig. 13.43, after one-quarter revolution (Aip = 90°), is presented in Fig. 13.44. The rotor for this example is untwisted and has a collective pitch angle of aR = 8°, to duplicate the geometry of the rotor tested by Caradonna and Tung.1315 The large difference between this spanwise loading (АЦі = 90°) and the experimental loading measured in Ref. 13.15, for a hovering rotor, are due to the undeveloped wake. This solution can be considerably improved by allowing about eight revolutions of the rotor, so that the wake induced flow will develop. This spiral vortex wake – induced downwash did reduce the spanwise lift distribution on the wake to values that are close to those measured by Caradonna and Tung,1315 as shown in Fig. 13.44 (by the “steady hover” line). The corresponding chordwise pressures, for three blade stations, are presented in Fig. 13.45. The computed pressures fall close to the measurements of Ref. 13.15 and the small deviations could be a result of the sparse panel grid used or could be due to experimental errors.
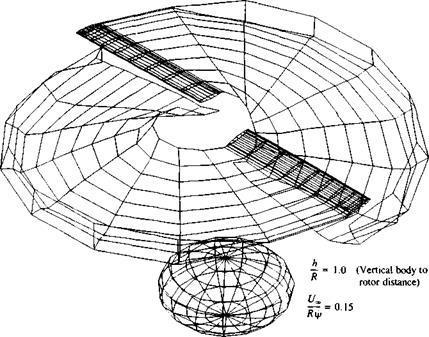
Increasing the complexity of the motion is fairly simple and the forward flight of this rotor with a generic body is shown in Fig. 13.46
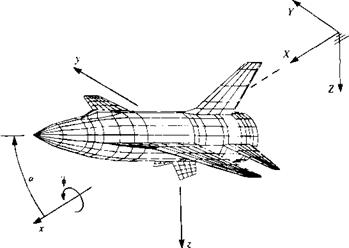
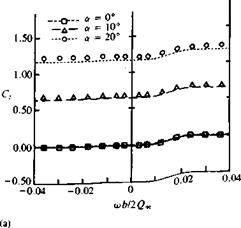
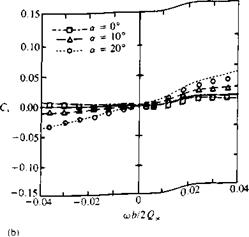
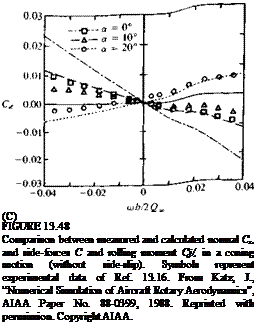
Example 4. Coning motion of a generic airplane. The coning motion is described schematically in Fig. 13.47 for the generic airplane geometry that was modeled by 718 panels per side. In principle the x coordinate of the body system translates forward at a constant speed Q„ and the model angle of attack is set within this frame of reference. The rotation <j> is performed about the x axis, as shown in the figure. Computed and experimental normal force C2, side-force Cy, and rolling moment C, are presented in Fig. 13.48a and b. The aircraft model was rotated about its center of gravity at a rate of up to <ub/2I7 = 0.04. This rate is fairly low, but representative of possible aircraft flight conditions and was selected to match the experiments of Ref. 13.16. The normal force is not affected by this low rotation rate and both experimental and computed lines are close to being horizontal. For higher angles of attack, the computational results are lower than the experimental data due to the vortex lift of the strakes. The side-force, in this type of motion, is influenced by the side-slip of the vertical and horizontal tail surfaces. Consequently, the computed values of Cy, for the above angle-of-attack range, are close to the experimental data.
The computed rolling moment of the configuration Cy at a = 0 (Fig. 13.48c) is much larger than shown by the experiment. However, most important is that the trend of the curve slope (which is really the roll damping) becoming negative at the larger angles of attack is captured by the computation. This slope is also a function of the distance between the wing’s center of pressure and the rotation axis, and the error in computing this distance is probably the reason for the larger (computed) rolling moments.
![]()
|
|
FIGURE 13.46 Wake shape behind a two-bladed rotor and a body in forward flight, after one half revolution. Inertial frame of reference |
|
FIGURE 13.47 Description of the standard dynamic model and of the coning motion. From Katz, J., “Numerical Simulation of Aircraft Rotary Aerodynamics”, AIAA Paper No. 88-0399, 1988. Reprinted with permission. Copyright AIAA. |
|
|
|
|
PROBLEMS
13.1. Consider a two-dimensional version of the relative motion described in Fig. 13.1, between a body-fixed frame of reference (дг, z) and an inertial frame (X, Z) such that
(X0, Zu) = (-Vj, – Wjt) в = sin (Ot and
(Xn, Z„) = (-fA, — WQ
6 = to cos cot
(a) Use the chain rule to evaluate the derivatives Э/ЭХ, Э/ 3Z, and Э/dt in terms of the body coordinates.
|
FIGURE 13.49 Nomenclature for the suddenly accelerated flat plate. |
(b) Using your results from (a) transform the Bernoulli equation
p„- p _ (УФ)2 ЭФ p 2 dt
into the (x, z) frame of reference.
13.2. The two-dimensional flat plate, shown in Fig. 13.49, is initially at rest and at t = 0+ it moves suddenly forward at a constant speed {/». Obtain the time – dependent circulation T(f) and lift L(t) of the flat plate using two chordwise lumped-vortex elements (select the vortex and collocation points as suggested in Section 11.1.1) with a discrete-vortex model for the wake and present your results graphically (as in Fig. 13.8).
(a) Study the effect of time step U„ At/c in the range U„ At/c = 0.02-0.2. Note that a smaller time step simulates a faster acceleration to the terminal speed U, o, and therefore has a physical effect on the results (in addition to the numerical effect).
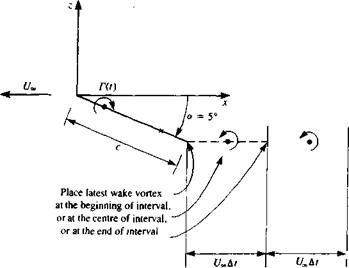
(b) Study the effect of wake vortex positioning by placing the latest trailing-edge vortex at the beginning, center, and end of the interval covered by the trailing edge during the latest time step (see Fig. 13.49). Compare your results with the more accurate calculations in Fig. 13.34 (for Ж = <»).
13.3. Use the flat-plate model of the previous example to study the constant acceleration of a flat plate. Assume that the forward speed is U(t) = at and the time step is a At1 lie = 0.1. Calculate the time-dependent circulation F(t) and lift L(f) of the flat plate for several values of the acceleration a and present your results graphically (as in Fig. 13.8). For simplicity, place the latest vortex shed from the trailing edge at one-third of the distance covered by the trailing edge during that time step.
13.4. Convert any of the two-dimensional panel codes of Chapter 11 (e. g., a constant-strength doublet method) to the unsteady mode and validate it by calculating the lift and circulation after a sudden acceleration. (This problem requires a larger effort and can be given as a final project.)


