Wake Geometry in Hover
Flow visualization images such as those shown in Fig. 10.5 can also be used to derive quantitative information by digitizing the locations of the seed void and the shear layer associated with the vortex sheet. Figure 10.6 shows the axial (z/R) and radial (y/R) displacements of the tip vortices as generated by one – and two-bladed hovering rotors operating at the same nominal blade loading coefficients; the total thrust of the two-bladed rotor is approximately twice that of the one-bladed rotor. The characteristics of the tip vortex geometry shown here are representative of the results that would be obtained with any lightly loaded hovering rotor. Up to the first blade passage, which occurs at a wake
Q/ ЛЛ (7. іp ІІлл numKat* rvf fUa fin irnrfi пар 1*417
/Jt^b VYVjLlwlw Л*Ь 10 tnv auiuuvi vrx uiauv^oy, uiv up vuiut’V/o gvuw’iaivu ujf
either of the rotors convect axially only relatively slowly. However, the effective axial (slipstream) velocity (gradient of displacement curve) is noted to increase abruptly after the first blade passage. Here, the tip vortex lies close to and radially inboard of the following blade and so is subjected to an increase in downwash velocity from both the blade and its associated tip vortex. During this process, the radial position of the tip vortices contracts progressively. While the higher thrust of the two-bladed rotor leads to a slightly more rapid wake contraction, the asymptotic values are approximately the same with y/R ~ 0.78.
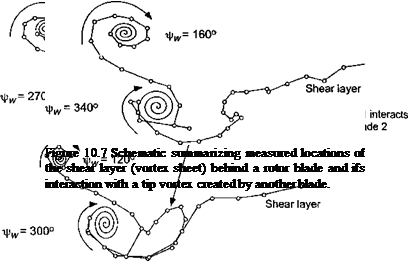
The interdependence of the flows between the vortex sheet and the tip vortex requires further discussion. The process is shown quantitatively in Fig. 10.7, where the displacements of the sheet have been digitized from flow visualization images such as those of Fig. 10.5. Initially, the vortex sheet is trailed along the entire length of the blade, with a concentrated tip vortex at the outboard edge. Both the tip vortex and the sheet then convect axially downward

![]()

![]()

 |
|
 |
|
Digitized points on shear layer / from flow visualization
below the rotor. The visualization images suggest that the distribution of induced velocity through the rotor is highest near the blade tip and lowest near the root. Therefore, the sheet convects more rapidly below the tip region of the blade (about twice the rate) and so it becomes more progressively inclined to the rotor plane. The high swirl velocities induced by the tip vortex cause a further distortion to the sheet, and it is apparent that the outboard edge of the sheet interacts with the tip vortex generated by another blade. This complex interaction between elements of the wakes generated by different lifting surfaces is fundamentally different from that found on fixed (nonrotating) wings and illustrates another level of complexity in the understanding and modeling of helicopter rotor wakes. Free-vortex methods generally capture the effects of the vortex roll-up relatively well. However, modem CFD methods, such as those discussed by Raddatz & Pahlke (1994) and Tang & Baeder
(1999) , have not yet allowed the details of the vortex sheet and the tip vortex to be fully resolved because of rapid artificial numerical diffusion associated with the characteristics of the finite-difference schemes – see Section 14.2.2.


