Correlation of Rotor Tip Vortex Data
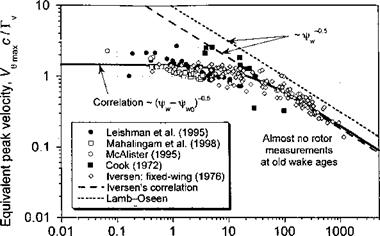
Figure 10.23 shows results derived from the tip vortex measurements in terms of an equivalent maximum nondimensional tangential velocity as a function of equivalent
nonuimensionai downstream distance irom tne up oi me oiaue. rouowmg an approacn similar to Iversen (1976), we can write the nondimensional velocity and distance (in terms of vortex or “wake” age) as
![Correlation of Rotor Tip Vortex Data Подпись: Figure 10.23 shows tip vortex measurements for subscale helicopter rotors that have been published by Leishman et al. (1995), Mahalingam & Komerath (1998), and McAlister et al. (1995). Also shown are measurements made by Cook (1972) when using a full-scale rotor. When the results are plotted in this manner, the data emphasize a strong correlation. The decreasing trend in the core swirl velocity, which is also observed in the fixed-wing case [see Iversen (1976)], confirms that the tip vortices diffuse logarithmically with increasing wake age. The measured data show the trend Vg^Xd + 2.197)5 = 2.782. Iversen reports a correlation region after a nondimensional distance of 50, where the data show the trend Vo^df'2 = 5.8. This decreasing trend in the peak swirl velocity results from viscous diffusion. For constant net vortex circulation, the nondimensional peak velocity is inversely proportional to the core radius, and the distance d is proportional to the wake age (i.e., а г"1 and d a fw). This is consistent with the experimental measurements shown previously in Fig. 10.22, where the core radius initially increases as the square root of wake age (i.e., rc ос s/Ww)- The theoretical Lamb result given previously for the viscous core growth can be written in terms of vortex age as](/img/3130/image1691.png)
![]()

 |
(10.34)
(10.35)
(10.36)
Substituting V0max = rv(l – e “)/2nrc, and using Eqs. 10.34 and 10.35, gives
 (10.37)
As shown previously, the Lamb-Oseen result can be modified empirically to include an average effective (turbulent) viscosity coefficient, 8, that is, Eq. 10.37 can be written as
 (10.38)
Comparing this with Iversen’s results in Fig. 10.23, we see that Iversen’s correlation is equivalent to including an effective turbulent viscosity coefficient that is proportional to the vortex Reynolds number, Tv/v. The peak velocity trend shown in Fig. 10.23 corresponds to the core growth trend
 (10.39)
The ordinate shift, if/WQ, results in a effective nonzero core radius, ro, at the tip vortex origin where x(fw = 0C and, therefore, a finite velocity at d = 0. However, in the other two models (i. e,, Lamb-Oseen and Squire models) the swirl velocity is singular at the origin of the tip vortex and unrealistically high at small distances (wake ages). However, at large downstream distances (wake ages), all three curves show the same qualitative trend, that is the velocity is inversely related to л/t (i. e., Vemax a or equivalently, the core radius increases in
proportion to л/t (i. e., rc OC fH2).
The viscous core growth trend as a function of wake age as derived from the above correlation trend has been plotted in Figure 10.22, along with the Lamb (laminar) result and a Lamb-type trend with a higher (constant) effective turbulent viscosity. Again, the differences between the two curves are obvious at early equivalent wake ages. At later wake ages, the two curves have a qualitatively similar behavior. At large wake ages, they will be almost coincident, that is
 (10.40)


