Drag rise in the transonic region
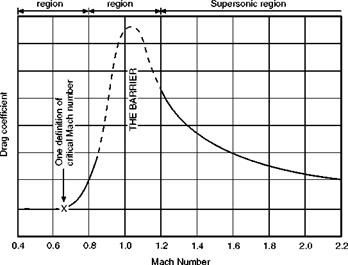
The behaviour of the drag coefficient, for a thin aerofoil shape at constant angle of attack, can best be illustrated by a diagram (Fig. 11.7). This shows that up to a Mach Number of about 0.7 the drag coefficient remains constant – which means that our elementary principles are true – then it begins to rise. According to one definition the Mach Number at which it begins to rise, in this example 0.7, is the critical Mach Number. At M of 0.8 and 0.85 CD is rising rapidly. Note that the curve then becomes dotted and the full line is resumed again at an M of about 1.2. The reason for this is interesting. For a long time, although it was possible to operate high-speed wind tunnels up to an M of about 0.85, and again at M of 1.2 or more, in the region of the speed of sound a shock wave developed right across the wind tunnel itself, the tunnel became ‘choked’ and the speed could not be maintained. Thus there were no reliable wind tunnel results in this region, and the dotted part of the curve was really an intelligent guess. This difficulty has now been overcome, and experiments have also been made by other means, by dropping bodies, or propelling them
|
Subsonic Transonic
|
Fig 11.7 Transonic drag rise with rockets and also, of course, by full-scale flight tests, and the guess can now be confirmed. Previous experiments on shells had of course suggested that there was nothing much wrong with it. The curve is still left dotted, partly to remind us of this bit of aeronautical history, but more now to emphasise the strange behaviour of the drag coefficient in the transonic region.
After a Mach Number of about 1.2, CD drops and eventually, at M of 2 or more becomes nearly constant again though at a higher value than the original, variously quoted as 2 or 3 times.
The diagram shows that there is a definite hurdle to be got over. But it also shows that conditions on the other side are again reasonable and that supersonic flight, as we now of course know only too well, is a practical proposition.
The reader is advised to work through Question 253 (Appendix 3) in which he will plot the actual drag, as distinct from the coefficient, and it will then be clear that the drag also actually falls after M = 1, but that the reduction is not quite so evident in terms of drag as in terms of drag coefficient.


