Families of slender aircraft
To explain the main physical characteristics of a slender aircraft, we consider a particular datum aircraft, designed on the basis of present technology. As a concession to the traditional reluctance to accept novel concepts on their technical merits, we take an example where the volume for the payload is contained in a separate fuselage and the lift produced by a slender wing attached to it. Thus the means for providing volume and lift of this datum aircraft are not integrated, and we shall discuss below what the probable penalties of this rather inconsistent approach are and what future improvements can be expected by a more rational design which is less inhibited by misplaced tradition. Nevertheless, the datum aircraft can be used to explain some properties of all slender wings, which are related to the fact that the geometry of the aircraft remains basically unchanged throughout the flight, in contrast to swept-winged aircraft where variable geometry plays an essential part in the design, as discussed in section 4.1.
For simplicity, the geometry of the datum aircraft is assumed to consist of a delta wing of length Лу and semispan s attached to a fuselage of length Л and fitted into a box with s/Л =0.25 . We take Лм/Л = 0.6 and assume that the fuselage provides only volume and does not carry any lift. The wing, with S = 400m2 and no provision for any variability, is then the only lifting surface at all speeds, and the relevant planform shape parameter from (4.138) is p = 0.3 . The overall volume in wing and fuselage is taken as 450m^, so that the volume parameter from equation (4.139), referred to the relatively small lifting area, has the relatively large value of т = 0.0563 .
Consider first cruising flight at Mg = 2 , so that В = 1.73 and Bs/Л = 0.433 . The general drag relation (4.140) can be used to work out values of the lift-to-drag ratio, assuming typical numbers for the various factors: Kg = 1.67 , corresponding to p^Kg = 0.15 , can be regarded as a reasonably good value for a shape which has not been specially designed;
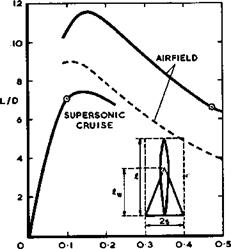
Ky = Ky = 1.2 , corresponding to pyKy = p^Ky = 0*6 (taking here the value of the planform parameter py = 0.5 of the lifting wing only), can also be regarded as reasonably good values. The overall value of the lift-dependent drag factor is then К = 2.45 , using the wing length, Л^ , in the last term of (4.140). For CDp , we take 2 x 0.002 for skin friction plus 0.0003 as the contribution of the fin plus 0.0007 for the drag of the engine installation, so that Cpp = 0.005 . With these numbers, we obtain the curve in Fig. 6.2 for L/D at the supersonic cruise. The maximum value (L/D)m = 7.4 and it is reached at a Cjjn of about 0.15.
|
Cl Fig. 6.2 Lift-to-drag ratios of slender datum aircraft |
Consider now flight at low speeds near the airfield, where we may use take-off at the (relatively high) speed of Va = 120m/s as a typical condition. The wavedrag terms in equation (4.140) then drop out. Because of the lower values of the Reynolds number and of the Mach number, Cpp should be somewhat higher than 0.005 and Cup = 0.0065 has been taken. For the lift-dependent drag factor, we take typically Ky = К – 1.5 . With these numbers, we obtain the airfield curve in Fig. 6.2 for L/D (full line), with a maximum value (L/D)m – 11.6 , again, as it happens, at а СТдт1 of about 0,15.
The lift-to-drag ratios of a typical slender aircraft in Fig. 6.2 look remarkably different from those of a typical subsonic swept aircraft in Fig.
4.1. There, the values are highest at cruise and drop considerably when the geometry is varied and high-lift devices extended for flight at low speeds. Here, the values at low speeds are considerably better than those at cruise; they are quite comparable to what can be achieved with a swept wing and demonstrate convincingly the constructive role of flow separation on slender wings.
The question now arises of how far these properties can be exploited in practice, i. e. where are suitable operating points on these curves? For instance, would it be possible to operate the aircraft at or near the maximum value of L/D, both at high and at low speeds, as can be arranged for the various configurations of a swept aircraft? In the example of Fig. 6.2, this would mean cLcr = CLa and hence qCr = qa. For Va = 120m/s, qa = 8.75kN/m^ and, for the given size (S – 400m^) , the overall weight would have to be W = 3500Cl3 kN. With CLa = Clcx: = 0.15 , we should have W = 526kN and W/S = 1.31 kN/m^ . Any higher weight or wing loading would mean operation below (L/D)m. To be consistent, the aircraft would have to be flown at a certain cruising altitude to reach the required value of qcr, which would be hcr * 23.5km for the values chosen. This demonstrates the importance of the wing loading as a design parameter. The consistency of these operating points obviously depends on whether the required weights can be achieved, i. e. primarily on the
weight of the structure, and on the weight of the engine needed to propel the aircraft at the required altitude. Therefore, we consider next some typical weight breakdowns, first for the datum aircraft.
The first-order analysis follows that derived by D Ktlchemann and J Weber 0 968) and is similar to that already applied in sections 1.2 and 4.1, but some changes are made to bring out some essential characteristics of slender wings. We consider again the various weight items which add up to a given all-up weight W :
|
WUc |
= 0.05W |
undercarriage |
|
ws |
= 0.05W |
services and equipment |
|
WP |
payload |
|
|
WFU |
= Wp |
furnishings etc. |
|
Wp |
fuel used |
|
|
wR |
= 0.1W |
reserve fuel |
|
Wg |
installed engine |
|
|
ww |
wing, including fuselage |
The main change is that we no longer assume that the wing structure weight is a constant fraction of the all-up weight but put
Wjj = ш]®с + ~ sc> + ш2^’^® » (6.3)
where S is the wing plan area and Sc the plan area of the cabin. The third term represents an allowance for the weight of the fin. mj is a specific weight factor for the cabin, and we take o)j = 0.6kN/m^ . u>2 is a specific weight factor for the rest of the aircraft, and we take <02 = 0.5 kN/m^. The cabin area itself is assumed to be related to the payload:
Sc[m^] = 10"3Wp[N] , so that the total wing weight in terms of the all-up weight is
^W —3 w2
ТГ " 10 °"i – “2) ТГ * 1,1 w7s • (6’4)
The engine weight fraction can be expressed as in (4.8) and is written here in the form
i. e. we assume, for the time being, that engine thrust and size are determined by the cruise condition and then check later whether or not this engine can provide the thrust needed at take-off. By taking C3 = 30kN/m2 , we assume that the engine and its installation are rather heavy. The fuel weight is assumed to be given by (4.6), as in Brdguet1s analysis. We take the range R = 6000km, corresponding to crossing the Atlantic Ocean, and np = 0.4 so that the range factor R/Hnp = 3.45 (see section 1.2 for general definitions and values).
The individual weight items can now be determined and added to find out how much payload, if any, is left. We observe that the weights of the fuel and of the engine depend strongly on L/D, both improving with increasing L/D, but that the engine weight increases with Cl (or, strictly, with CD). Further, both the wing and engine weights depend strongly on W/S and improve
with increasing wing loading* These relations determine the main trends which interest us here. Typical results are shown in Fig. 6.3 for the datum aircraft where size and wing loading are fixed. W/S * 4.15kN/m^ and hence
. The weights are plotted against the lift coefficient at cruise or against the parameter n, defined by (4.3), n = 1 indicating operation at the maximum value of L/D. We find once again how precariously the payload is squeezed in between the other component weights which are required, for the purpose of providing for a payload and for lifting and propelling it. As before, we find that it does not pay to fly at the aerodynamic optimum (L/D)m : the engine is already too heavy at that point. Thus ncr = 0.96 and Сьсг/Стлп = 0*^6 to give optimum payload, which is Wp/W « 0.073 . The cruising height is then hcr = 14.2km 9 i. e. above the tropopause at h – 10.8km. The aircraft could fly lower (e. g. h = 10.2km
at Cx/Cjjn * 0.4) or higher (e. g. h * 18.1km at Ст./Су.^ * 1.4) , but such departures from the optimum point lead to serious losses in payload.
Consider now the airfield performance of the aircraft where, for simplicity, we assume that take-off at Va = 120m/s is the limiting operation. The engine thrust available is assumed to be related to the engine weight by
As we are interested here only in first-order answers, we assume that the value of Tha/W can be determined from only two conditions: that it should be sufficient to accelerate the mass of the aircraft on the runway to a certain speed (Va) within a given length (f, a) ; and that it should be sufficient subsequently to achieve a given climb angle (9a) without further acceleration. Both these motions are governed by the equation
where s is the coordinate along the runway and h that normal to it. For the motion on the runway, this gives a first-order relation for Tha/W, which shows Tha/W to be proportional to and inversely proportional to
£a. Here, we simply assume that X. a can always be made sufficiently long. We assume further that the thrust to be determined will be sufficient for the aircraft to perform a lift-off manoeuvre between leaving the runway and reach ing a constant initial climb angle. The motion along the initial climb path is taken as one at a constant inclination
and at a constant speed,
V = V = const, a
at a lift coefficient
n W/S
uLa. ..2 ‘
Ip V zta a
The equation of motion (6.7) then gives, together with the general drag relation,
For the wing loading of the datum aircraft and for the assumed take-off speed cLa = 0.474 and Tha/W = 0.2 if 0a = 3° . Thus WE/W = 0.06 by (6.6). This is well below any of the engine weights needed for cruise (Fig. 6.3): in this simple analysis where cruising and take-off conditions are considered to a first order only, the engine is sized for cruise.
We can now go back to Fig. 6.2 and mark the two main operating points (circles), which makes us realise that the flight conditions described above cannot be obtained with this datum aircraft: the lift coefficients at cruise and at take-off (0.11 and 0.47) are not the same but differ by a factor of 4.3; the aircraft is much heavier (W = 1660kN instead of 526Ш) and the wing loading much higher (W/S = 4.15kN/m2 instead of 1.31kN/m2); it cannot cruise at her = 23.5km but must fly much lower at hcr = 14.2km to have a reasonable payload. Thus the aircraft is operated from the airfield at a value of the lift-to-drag ratio which is well below the maximum attainable ((L/D)a = 6.6, = 0.57(L/D)m) quite unlike the swept aircraft in Fig. 4.1.
It is misleading to say that the constant-geometry slender aircraft has a
poor lift and a high drag at low speeds; it is more to the point to say that engine and structure weights prevent the proper exploitation of the aerodynamics of the slender aircraft.
Fig. 6.2 also contains a dashed line for the airfield performance, which has been estimated on the assumption that there is no vortex flow and hence no non-linear lift contribution. This demonstrates very clearly how vital the extra lift generated by the vortex sheet really is.
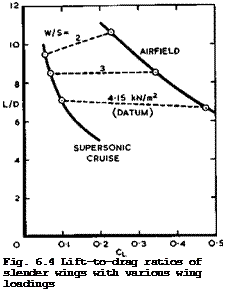
Using the same set of aerodynamic and weight relations as above, we now consider whole families of related slender aircraft, to begin with, one whose members are geometrically similar to the datum aircraft but have different sizes, so that the wing loading is varied, while the overall weight W and Mcr are kept constant. Aerodynamically, a reduction of the wing loading below that of the datum aircraft is strongly beneficial, as can be seen from some results in Fig, 6.4: it allows flight at lower C^-values and higher
 LIVE GRAPH
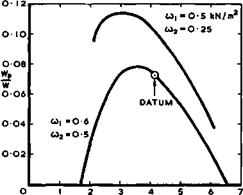
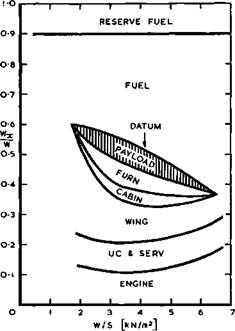
Click here to view altitudes (e. g. hcr is over 17km for W/S « 2kN/m2) at generally higher values of L/D, and it brings the two operating points considered here closer together. However, engine and structure weights tend to wipe out the aerodynamic advantage, as indicated by the payload fraction in Fig. 6.5 for the datum level of technology (wj » 0.6kN/m2 and u)2 ■ 0.3kN/m2) . How this comes about can be seen from the detailed weight breakdown in Fig. 6.6: the larger wing weight is mainly responsible. The datum aircraft has nearly the optimum wing loading. Thus it turns out that the wing loading is a powerful design parameter to achieve good aerodynamic characteristics but that it can only be applied for this purpose if means can be found to improve the structural technology. If the specific weight factors of cabin and wing could be reduced to Ш] ш 0.5kN/m2 and W2 ■ 0.25kN/m2 , the payload fraction would be increased by over 50%, as shown by the results in Fig. 6.5. Lower wing loadings near 3kN/m2 could then be used.
LIVE GRAPH
Click here to view
|
|
|
|
|
|
|
|
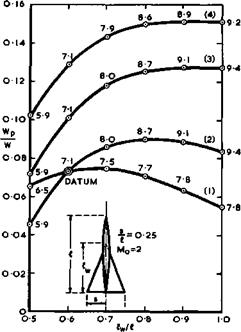
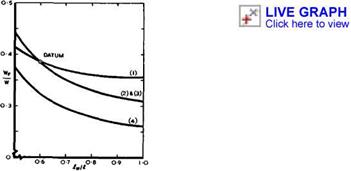
To investigate possible improvements beyond the datum aircraft from various sources more systematically, we consider four different families of slender aircraft. The cruise Mach number, the overall slenderness ratio s/Я, the all-up mass and the overall volume are kept constant for all, and the optimum payload fraction Wp/W is determined, as described above. The first of the
families contains the datum aircraft (with йу/Й = 0.6) ; the length of the wing is varied between йу/й m 0.5 and 1.0, the latter designating a fully – integrated aircraft without fuselage. For the first family (1), a relatively poor set of aerodynamic drag factors has been assumed; their values are suitably varied with йу/й, Kq decreases as йу/й increases because a smoother shape should result, and Ky and Ky increase because some trim drag might be incurred. For the other families (2), (3), and (4), it has been assumed that the aircraft are more carefully designed to have better aerodynamies, so that Kg decreases substantially as йу/й increases and there is no trim drag penalty and Ky and Ky remain the same. As will be seen below, these are still modest values and should be attainable. The actual numbers taken are listed in the table below.
|
v* – |
0.5 0.6 |
0.7 |
0.8 |
0.9 |
1.0 |
||
|
f |
Kn = |
2.00 1.67 |
1.43 |
1.25 |
1.11 |
1.00 |
|
|
(1)< |
1 |
и |
|||||
|
к |
– – |
1.12 1.20 |
1.28 |
1.35 |
1.43 |
1.50 |
|
|
(2) |
r |
Kn “ |
2.40 1.67 |
1.23 |
0.94 |
0.74 |
0.60 |
|
(3)i |
1 |
u |
|||||
|
(4) |
к |
– *w – |
1.20 1.20 |
1.20 |
1.20 |
1.20 |
1.20 |
|
np |
<i)j[kN/m^3 |
u |
>2 [kN/m2} |
||||
|
0) |
0.4 |
0.6 |
0.5 |
||||
|
(2) |
0.4 |
0.6 |
0.5 |
||||
|
(3) |
0.4 |
0.5 |
0.25 |
||||
|
(4) |
0.5 |
0.5 |
0.25 |
At the same time, we can investigate the effects which improved propulsive efficiency and lighter structure weights may bring about. For the first two families of aircraft (1) and (2), we use the same values for rip and (i)j and Ш2 as above, which roughly correspond to present technology. Thus the differences between (1) and (2) are caused entirely by aerodynamic improvements. For (3), we assume again that the specific weight factors for cabin and wing can be reduced. Keeping these values, we assume in addition that family (4) has a more efficient engine. Thus the differences between (2) and (3) give an indication of the consequences of structural improvements and those between (3) and (4) an indication of the effect of raising the propulsive efficiency. The actual numbers taken are also listed in the table above.
The resulting optimum payload fractions for the four families of slender aircraft are shown in Fig. 6.7. The numbers assigned to the points are the values of L/D at the cruise condition. These results lead to some clear-cut conclusions: on present technology and with relatively poor aerodynamics, a conventional wing-fuselage combination, like the datum aircraft, appears to be the right choice, for the size of aircraft considered, on the criterion of achieving the best payload fraction. However, if the fuel fraction were to be a criterion that mattered more, then the corresponding results in Fig. 6.8 show that a more integrated design without distinct fuselage would be preferable. But it is also clear from these results that there is a real potential for substantial improvements: a more careful aerodynamic design (2) would
LIVE GRAPH
Click here to view
|
Fig. 6.7 Optimum payload fractions of families of slender wings with fuselage |
|
Fig. 6.8 Fuel fractions needed for the family of slender aircraft of Fig. 6.7 |
increase the payload and reduce the fuel used and would favour layouts where a distinct fuselage protrudes very little ahead of the wing or where the cabin is completely integrated within the wing. The same conclusion comes out more strongly from the results for series (3): The aerodynamic concept of slender
wings involves lightly-loaded structures and would benefit greatly from new methods of construction and new materials leading to lighter specific weights. A structure where the strong members are a very slim fuselage and a spar across it, as for an unswept wing of high aspect ratio, does not fit the
concept of the slender wing. A large enough aircraft, where a flat cabin of non-circular cross-section inside the wing, possibly with buried engines, provides a strong backbone surrounded by a suitably-designed light wing structure, would appear to offer a more promising prospect. Such integrated layouts are also favoured if more efficient engines could be developed, as shown by the results for family (4). Larger sizes would also be generally beneficial.
Similar results have been obtained by J В W Edwards Cl 968) who studied systematically possible improvements beyond the present datum standards and concluded that the returns can be large if derived from improvements in technological standards rather than from a more conventional ‘stretching* procedure. Many specific design aspects can continue to make slender aircraft more economical than the datum aircraft considered here. Typically, Edwards found that a reduction by 20% in the volume-dependent drag factor Kq would lead to an increase of the payload fraction by 12%; that 20% less specific wing weight (u>2) would make the payload 14% greater; that 50% less engine installation drag would make the payload 14% greater; that 5% less specific fuel consumption would make the payload 11% greater; and that 20% less specific engine weight (сз in equation (6.5)) would make the payload 16% greater. We also note in this context that the weight breakdowns in Figs. 6.3 and 6.6 indicate that much may be gained by designing lighter furnishings, services, undercarriages etc. Further, a more refined air-traffic-control system might allow a reduction of the reserve fuel which, in most of our examples, weighs more than the useful payload. Similar conclusions have also been reached by C S Leyman & В Furness (1975) in a review of the prospects for second – generation supersonic transport aircraft. Reasonable objectives would be a substantial reduction of the engine noise and improvements in take-off and cruise performance while increasing the payload fraction to values approaching 10%. To meet all of these together, a variabte-eyole engine may be needed.
Two schemes for such engines have been outlined by R M Denning & T Jordan
(1974) . An airflow switch is used in both to allow a proportion of the compressed air to be exhausted and extra air to be aspirated at subsonic speeds. An extra fan is then used to increase the mass flow by about 50%. All these results demonstrate very clearly that the present first generation of slender supersonic aircraft should be regarded only as a beginning and that future generations may be more economical.
We learn from these results that, in discussing the aerodynamic design of slender wings in more detail below, we should pay special attention to thick lifting wings without, or with only a small, fuselage. The results also give clear indications of the aerodynamic design aims: to achieve low values of the drag factors with shapes which allow a lightweight construction. At low speeds, in particular, it is desirable to reach a low drag for a given lift and to operate as close as possible to the maximum value of L/D rather than to try to increase at the cost of more and more drag. Also, much may be
gained by an aerodynamically efficient engine installation. For a review of possible future developments, from another point of view, we refer to a paper by L К Loftin Jr (1974).


