Observation of shock waves
The understanding of shock waves is so important to the understanding of the problems of high-speed flight that it is worth going to a lot of trouble to learn as much as we can about them.
As we remarked so often in dealing with flight at subsonic speeds, it would all be so much easier to understand if we could see the air. Well, fortunately we almost can see shock waves; they are not merely imaginary lines, lines drawn on diagrams just to illustrate something which isn’t actually there, they
![]() Subsonic flow M= 0.6
Subsonic flow M= 0.6
 |
Fig 11.3 Breakaway of airflow
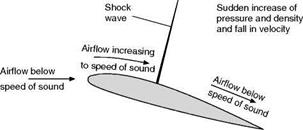
Fig 11.4 Incipient shock wave
|
|
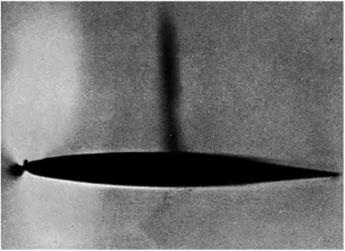
Fig 11A Incipient shock wave
(By courtesy of the Shell Petroleum Co Ltd)
An incipient shock wave (taken by schlieren photography) has formed on the upper surface; the light areas near the leading edge are expansion regions, separated by the stagnation area which appears as a dark blob at the nose.
are physical phenomena which can be photographed in the laboratory by suitable optical means, and in certain conditions they may even be visible to the naked eye.
The photographic methods depend on the fact that rays of light are bent if there are changes of density in their path. In the ‘direct shadow’ method the shock wave appears on a ground-glass screen, or on a photographic plate, as a dark band with a lighter band on the high-pressure side. But the system that has proved most effective is known as the ‘schlieren’ method, and the results obtained by it are so illuminating, and have contributed so much to our understanding of the subject, that the method itself deserves a brief description. The word ‘schlieren’, by the way, is not the name of some German or Austrian scientist, but simply the German word for streaking or striation, which is descriptive of the method; nor is the method itself modern, it was used a hundred years ago for finding streaks and other flaws in mirrors and lenses, just as it now finds ‘flaws’ or changes of density in the air.
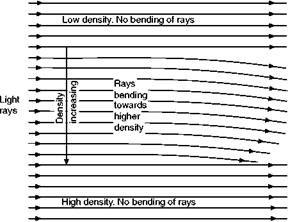
The fundamental principle behind the schlieren method is that light travels more slowly through denser air; so if the density of air is changing across, or at right angles to, the direction in which light rays are travelling, the rays will be bent or deflected towards the higher density (Fig. 11.5). Notice that the bending only takes place when the density of the air is changing (across the path of the rays) – there is no bending when the rays pass through air density which is constant across their path, nor if the density changes along their path; in those cases the rays are merely slowed up by high density.
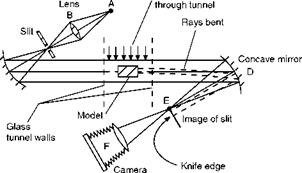
Figure 11.6 (overleaf) shows a typical arrangement of mirrors and lenses as used in the schlieren method. From a light source A the rays pass through a lens B, to a concave mirror C, which reflects parallel rays through the glass walls of a wind tunnel to another concave mirror D, which in turn reflects the rays on to a knife edge at E, where an image of the light source is formed. Rays that pass through changing density near the model in the tunnel are bent, those passing through falling density being deflected one way, and those passing through rising density the other way. At E either more or less light will be let through depending on whether the ray has been deflected onto or away from the knife edge by the density changes. Thus the image of the working section at F will show light or dark areas (Fig. 11 A). In a film on High-speed Flight produced by the Shell Petroleum Company, to whom I am indebted for these schlieren pictures, a colour filter was used at E and in this ingenious way increasing density was shown on the screen in one colour, decreasing density in another, and unchanging density in yet another; thus giving a real live picture of changes of density as the air flowed over different shapes at different speeds.
It is interesting to note that whereas the schlieren method reveals the change of density in a certain distance, the direct shadow method shows changing rates of density change, and other methods, such as the Mach Zender and laser interferometers, the actual density in different places. So each method has its advantages, but each needs rather different interpretation if we are to realise exactly what it is showing us.
Figure 11A is a photograph of a shock wave obtained by the schlieren method, and the fact that it appears as a narrow strip at right angles to the top surface of the aerofoil shows that across the strip there is a sudden increase in
|
|
Fig 11.5 Bending of light rays through changing density
|
Light source Airflow
|
Fig 11.6 Arrangement for schlieren photography View from above.
density. Immediately behind and immediately in front of the strip the density is reasonably constant, though greater of course behind than in front. Colour photography reveals another small area of increasing density immediately in front of the nose of the aerofoil as we might expect, and a large area above the nose and a smaller area below in which the density is decreasing.
Schlieren pictures of airflow at speeds well below that of sound show no appreciable changes of density at all, so now we see the fundamental change that takes place as we approach the speed of sound; the air begins to reveal its true nature as a very compressible – and expandable – fluid.


