Aircraft Model in Transonic Flow
Engler et al. (2001b) measured the pressure distributions and aerodynamic loads on an AerMacchi M-346 Advanced Trainer Aircraft model at the angles of attack from -4° to 36° and the angles of sideslip from -13° to 13° over a Mach number range of 0.6-0.95. Their experiments represented a good example of PSP application to a complex model with flaps, air brakes, rudders and ailerons in a production wind tunnel, which utilized a two-luminophore PSP, eight CCD cameras and 16 fiber optics illumination heads. In addition, control of PSP hardware and interface with a standard wind tunnel data acquisition/processing system became an operational issue in a production wind tunnel.
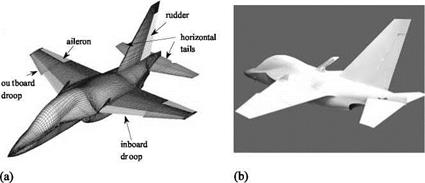
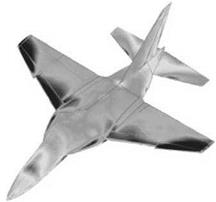
Experiments were conducted in the industrial wind tunnel with a 1.8×1.8 m test-section at DNW-HST in Amsterdam, The Netherlands. The AerMacchi M – 346 advanced trainer aircraft model had a 1.2-m length and a 1.0-m span. Figure 9.20 shows a surface grid and a painted model with exchangeable flaps, air brakes, rudders and ailerons. Since a total of 19 configurations were tested, 20 additional model parts were painted besides the basic model. All the parts of the complex model were illuminated and captured by CCD cameras placed around it in order to measure the aerodynamic effects at high angles-of-attack and angles of sideslip for maneuvers influenced by flaps, air brakes, rudders and ailerons. To overcome the problems of shadows and inhomogeneous illumination for excitation, the Pyrene – based two-luminophore B1 PSP from OPTROD was employed. In addition, since this PSP had weak temperature dependency, the error due to the temperature effect could be reduced.
|
Fig. 9.20. The AerMacchi M-346 advanced trainer aircraft model, (a) surface grid, (b) PSP coated model. From Engler et al. (2001b) |
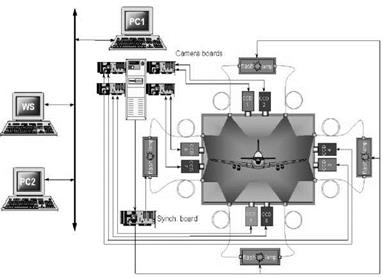
As shown in Fig. 9.21, at each of four observation directions, an UV light source connected to four 20-m long optic fibers; thus, a total of 16 fiber optics heads connected with four UV light sources illuminated the whole model from all the four directions. Eight cooled 12-bit CCD cameras were used for image acquisition. At each observation direction, a twin-CCD-camera unit with different filters was used to acquire in parallel the pressure signal at 450-550 nm (blue) and reference signal at 600-650 nm (red). Figure 9.21 shows a twin-CCD-camera unit and illuminator heads installed on the wall of the test-section. The use of the twin – CCD-camera unit eliminated a filter-shifting device that could not be immune from unsteadiness of the light sources. In this arrangement of cameras and lights, the exposure time was typically 15 seconds for a camera placed at 1 m away from the model.
As PSP was integrated into a standard wind tunnel measurement system, accurate and rapid acquisition and transmission of data became an important issue to decrease the wind tunnel run time. An automatic trigger and data exchange system was used. After acquisition of a set of ‘blue’ and ‘red’ images by the four twin-CCD-camera units (eight CCD cameras), a TTL ready signal from the PSP system was sent to the wind tunnel control/data system, and the flow parameters and model attitudes were adjusted and recorded for next run. After the above process was completed, a TTL trigger signal from the tunnel control/data system activated all the cameras and lights for new PSP measurements.
Given limited illumination sources (16 illuminator heads) for the complex model, shadows were inevitably generated mainly by vertical rudders on the fuselage and horizontal tails. The effect of shadows was largely eliminated using the ratio-of-ratios approach for the pressure (blue) and reference (red) images in the wind-on and wind-off cases (four images in total). In some areas without PSP like registration markers, screws and damaged spots, pressure was given by a proper interpolation scheme from PSP data around these areas.
|
Fig. 9.21. PSP system including twin-CCD-camera units, fiber optics illuminators, computers for data/image acquisition. From Engler et al. (2001b) |
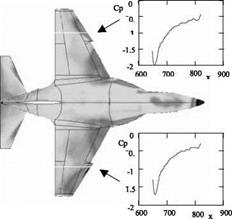
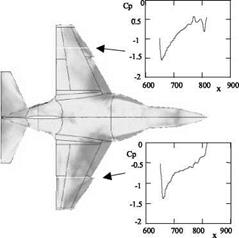
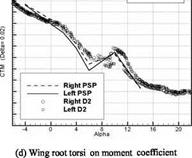
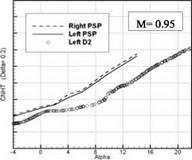
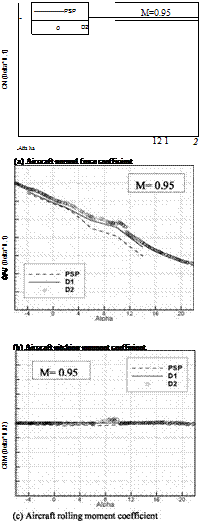
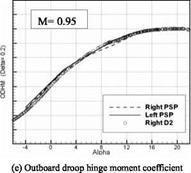
Figures 9.22 and 9.23 show the distributions of the pressure coefficient Cp on the upper surface of the model for the clean configuration and the configuration with positive and negative ailerons at Mach 0.6 and the angle-of-attack of 14o. It can be seen that the pressure distribution is significantly altered from one configuration to another. The pressure distributions along the lines on the wings indicate a symmetric pressure field with respect to the model centerline for the clean wing configuration, in contrast to the asymmetric one for the configuration with the positive and negative ailerons. Figure 9.24 shows a typical pressure field mapped onto a 3D grid of the model. PSP data were first mapped onto the upper, lower, left and right parts of the model grid, and then these parts were merged into a complete 3D surface of the model. From the 3D PSP data on the model surface, Engler et al. (2001b) calculated the coefficients of the normal force (CN), pitching moment (CPM), rolling moment (CRM), wing root torsion moment (CTM), outboard droop hinge moment (ODHM), and horizontal tail normal force (CNHT). Figure 9.25 shows the aerodynamic force and moment coefficients obtained from PSP along with data given by a balance at Mach 0.95 on the configuration with the leading edge droop set to zero. In Fig. 9.25, D1 denotes the data obtained by a six-component balance during PSP tests and D2 denotes balance measurements on the same model without PSP in previous wind tunnel tests. The PSP-derived aerodynamic loads were in reasonable agreement with the balance data except for the horizontal tail normal force. Previous balance data indicated the existence of the forebody side force at high angles-of-attack, which was caused by the asymmetric boundary layer separation and vortex system. In these cases, PSP indeed showed the asymmetric pressure fields on the wings.
|
Fig. 9.22. The pressure coefficient (Cp) distributions along the lines on the upper surface on the model for the clean configuration at Mach 0.6 and the angle of attack of 14°. From Engler et al. (2001b) |
![]()
|
|
|
 |
|
|
|
||
![]()
Fig. 9.25. The coefficients of aerodynamic loads obtained from PSP compared with the force balance data. From Engler et al. (2001b)


