Numerics
We demonstrate the influence of uncertainties in the angle of attack, the Mach number and the airfoil geometry on the solution (the pressure, density, lift, drag, lift and absolute skin friction coefficients). As an example we consider two-dimensional RAE-2822 airfoil. The deterministic solver is the TAU code with the k-w turbulence model. To quantify uncertainties we used the collocation method computed in nodes of sparse Gauss-Hermite grid. The Hermite polynomials are of order P = {1,2, 4} with M random variables (see Eq. 10).
The last column in Tables 3 on the left and on the right shows the measure of uncertainty c/mean. It shows that 7.1% and 0.4% of uncertainties in a and in Ma correspondingly result in 4.4% and 16.3% (Table 3, on the right) of uncertainties in the lift CL and drag CD. For the comparison of different sparse grids see [13, 15].
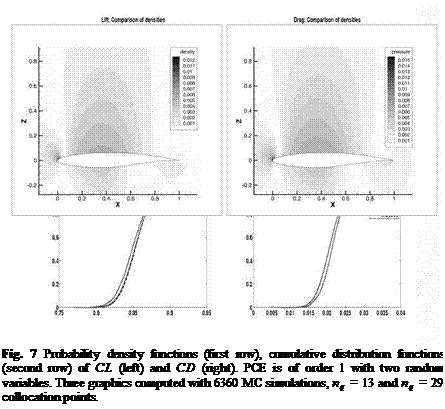
In Fig. 7 we compare the cumulative distribution and density functions for the lift and drag coefficients, obtained via PCE and via 6300 Monte Carlo simulations. The response surface is PCE of order 1. There are 106 MC evaluations of the response surface. We see three very similar graphics. Thus, one can make the conclusion that the sparse Gauss-Hermite grid with a small number of points, e. g. nq = 13, produces similar to MC results.
In Fig. 8 we compare the mean values computed by collocation and Monte Carlo methods for the Case 1. The collocation points are 281 nodes of two-dimensional
 |
 |
Table 3 Uncertainties in the input parameters (a(6, 02) and Ma(6, 62)) and in the solution (CL and CD). PCE of order 1 and sparse Gauss-Hermite grid with 137 points.
 |
Fig. 8 (left) ІІРМС “PSGhII and (rfght) 11 PMC “ PSGH II – PSGH was computed from the sparse Gauss Hermite grid with 281 nodes. PsgH ^ (0.65,1.2), p$GH ^ (0-7,1.3). Case 1.
sparse Gauss Hermite grid. One can see that the difference is very small compared to the corresponding physical values PsgH and PSGH.
|
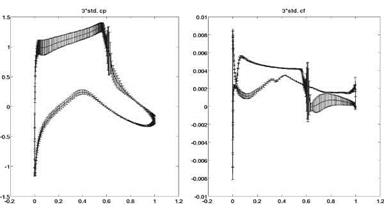
Fig. 9 3o error bars in each point of the RAE-2822 airfoil surface for the pressure coefficient cp (left) and friction coefficient cf (right). |
The graphics in Fig. 9 demonstrate 3 a error bars, a the standard deviation, for the pressure cp and absolute skin friction cf coefficients in each surface point of the RAE-2822 airfoil. The data are obtained from 645 realisation of the solution. One can see that the largest uncertainty occurs at the shock (x « 0.6). A possible explanation is that the shock position is expected to change slightly with varying parameters a and Ma.
In Table 4 one can see relative errors of the rank-& approximations (in the Frobenius norm). Five solution matrices contain pressure, density, turbulence kinetic energy (tke), turbulence omega (to) and eddy viscosity (ev) in the whole computational domain with 260000 dofs. Additionally, one can also see much smaller memory requirement (dense matrix format costs 1.25GB). The column 7 shows the computing time required for the SVD-update (the Algorithm described in Section 5.1) and the the column 8 time required for the full SVD of the global matrix Є r260000x600 correspondingly. A possible explanation for the large computing time for the full SVD is the lack of memory and expensive swapping of data.
|
Table 4 Relative errors and computational requirements of rank-k approximations of the solution matrices Є r260000x600. Memory required for the storage of each matrix in the dense matrix format is 1.25 GB.
|
|
Table 5 Rank-k approximation errors of the variance of pressure and of the variance of density in Case 9
|
In Table 5 we provide the rank k = {5,30} approximation errors (in the maximum norm) of the variance of the pressure and of the density (compare with Fig. 5). The variances var(p)k(x) and var(pk)(x) were computed from the matrix W є R65568x1521 as described in Section 5.
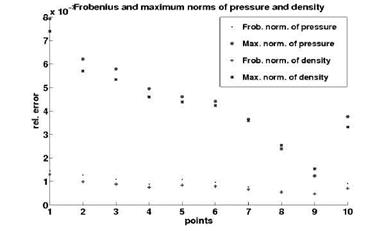
Further, we consider Case 1 (a = 1.93 and Ma = 0.676, no shock). Fig. 10 shows relative errors (for the Case 1) in the Frobenius and the maximum norms for pressure and density computed in 10 points of a two-dimensional sparse Gauss-Hermite grid. These relative errors compare the solution which we obtain after 10000 TAU iterations without any start value with the solution which we obtain after only 2000 TAU iterations with start values taken from the response surface (multivariate Hermite polynomials with M = 2 variables and of order P = 2). One can see that the errors are very small (of order 10~3), i. e. the response surface produces a good approximation. We note that 10 chosen points are lying in a small neighbourhood of the point a = 1.93 andMa = 0.676.
|
Fig. 10 Relative errors (Case 1) in the Frobenius and the maximum norms for the pressure and density |


