Ramp-Type (Edney Type VI and V) Interaction
We study first the control-surface/inlet-ramp problem and discuss a few critical modeling items with the help of results of mainly computational simulations for two-dimensional flat-plate/wedge flows, which we for convenience call simply ramp flows.[158]
Basic experiments on laminar and turbulent supersonic and hypersonic flows of this kind were performed by M. S. Holden, who established the influence of the main parameters ramp angle, Mach number, and Reynolds number [27].
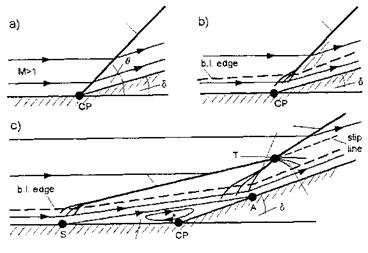
The basic flow phenomena of separated ramp flow are shown schematically in Fig. 9.6 c). The flow field is very complex compared to that of the inviscid flow case, Fig. 9.6 a), where we have simply the flow deflection through an oblique shock, addressed in Sub-Section 6.3.2, Fig. 6.9, and that of the non- separated viscous flow case, Fig. 9.6 b). Note here that the shock wave reaches down into the supersonic portion of the boundary layer.
The interaction shown in Fig. 9.6 c) is a Edney type VI interaction.[159] The flow field harbors three shocks. The separation shock, induced by the flow deflection due to the separation regime, and the inner reattachment shock, induced by the final reflection of the flow at the ramp do not cross each other, because they belong to the same family, see Sub-Section 6.3.2. They meet in the triple point T and form a single stronger shock, the outer reattachment shock. A slip line and an expansion fan originate at the triple point T. In the turbulent flow case a basically similar flow field results.
The upstream influence of the ramp increases with increasing ramp angle, decreases with increasing Mach number, and is affected by the Reynolds number, however only weakly in turbulent flow. The length of the separation region, Fig. 9.6 c) (distance between the locations A and S), which is a measure of the strength of the interaction, increases with increasing ramp angle and decreases with increasing Mach number. In general laminar and turbulent flows are affected in the same way, the interaction being weaker for turbulent flows. Bluntness of the leading edge of the flat-plate/wedge configuration reduces the pressure and the heat flux in the gas at the wall.
 separation region
Fig. 9.6. Schematics of two-dimensional flows over a ramp (flat plate/wedge) configuration: a) inviscid flow, b) viscous flow with non-separating boundary layer, c) laminar viscous flow with (local) separation. S denotes the separation point, A the reattachment point, T the triple point, and CP the corner point.
Example: Two-Dimensional Laminar Flow. We discuss now results of a 15° laminar ramp-flow case, which was investigated computationally for different wall temperatures [28]. The radiation-adiabatic surface was included, however without non-convex effects, Sub-Section 3.2.5. The flow parameters are given in Table 9.2.
|
Table 9.2. Flow parameters of the ramp computation cases [28].
|
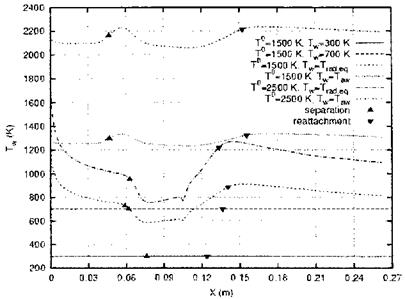
Fig. 9.7 gives the computed Tw(x) for two radiation-adiabatic cases (Trad. eq = Tra) with the total temperatures (T0 = Tt = 1,500 K and 2,500 K), as well as two adiabatic wall cases for the same total temperatures. Two prescribed isothermal wall temperatures, Tw = 300 K and 700 K are indicated, too.
The computations in [28] were made assuming perfect gas, although the total temperatures are large. The two adiabatic results are varying with x, each having a first weak maximum shortly downstream of the separation
|
Fig. 9.7. Wall temperature distributions Tw (x) on a ramp configuration and separation and attachment points [28]. Ramp angle S = 15°, the corner point of the ramp lies 10.5 cm downstream of the sharp leading edge, T0 = Tt, Trad. eq = Tra. |
point, and a second weaker maximum shortly downstream of the reattachment point.[160]
The radiation-adiabatic temperatures ahead of the separation points behave as expected for flat-plate laminar flow (Tra ж ж~0Л25), Sub-Section 3.2.1. Downstream of the reattachment points, however, they follow that trend only approximately. Their ratio does not scale well, Sub-Section 3.2.6.
Both radiation-adiabatic temperatures (Trad, eq = Tra) lie well below their respective adiabatic temperatures and are strongly dependent on x. Neither the adiabatic temperatures (Taw = Ta) nor constant wall temperatures would be representative for them. The well pronounced dips in the separation regions indicate an enlargement of the characteristic thicknesses A, eq. (3.15). The subsequent rise to larger temperatures in both cases is due to the rise of the unit Reynolds numbers downstream of the interaction zones, Section 6.6, which leads to a thinning of the boundary layer.
The distance of the separation point from the leading edge is largest for Tw = 300 K. For Tw = 700 K it is shorter, but nearly the same as that for the two radiation-adiabatic cases. For the two adiabatic cases it is even shorter. Here also the separation length is largest, while it is similar for the two radiation-adiabatic cases and the Tw = 700 K case. It is shortest for Tw = 300 K.[161]
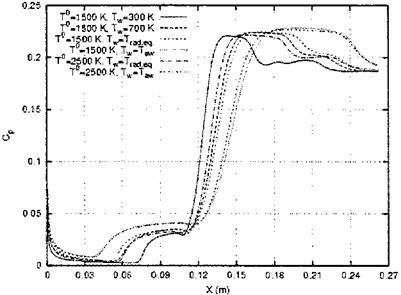
This all is reflected in the pressure-coefficient distributions in Fig. 9.8, each having a pronounced increase at the separation location (due to the separation shock, Fig. 9.6 c)) and in the reattachment region (due to the reattachment shock, Fig. 9.6 c)). The pressure has in each case also a relative maximum at the leading edge which is a result of hypersonic viscous interaction, Section 9.3. It drops then for all wall-temperature cases, the two adiabatic wall cases showing the smallest drop. These have also the most upstream located separation points, the largest and highest pressure plateau ahead of the corner point and then the smallest slope, but again the largest pressure plateau behind the reattachment point. The maximum pressures there are nearly the same for all cases. The separation point for the Tw = 300 K case lies closest to the corner point, the pressure rises then with the steepest slope to the smallest and lowest plateau. Then again it rises most steeply to the smallest plateau behind the reattachment point. The two radiation-adiabatic cases and the Tw = 700 K case lie close together with slightly different plateau extensions behind the reattachment points.
|
Fig. 9.8. Wall pressure distributions cp(x) on a ramp configuration as function of the surface temperature [28]. Ramp angle S = 15°, the corner point of the ramp lies 10.5 cm downstream of the sharp leading edge, T0 = Tt, Trad. eq = Tra. |
We see from these results that the surface temperature indeed is an important parameter. Whether it can be correlated with the help of the Reynolds number with reference-temperature extension, Sub-Section 7.1.6, has not been established yet. Of course, high-temperature real-gas effects play a role, too, and so does the state of the boundary layer, if the flight occurs at altitudes where laminar-turbulent transition occurs.
Finally it is a question how the different pressure distributions due to different surface temperatures affect the flap effectiveness. In [29], for instance, this was investigated for a FESTIP RV configuration. The flow past the body contour in the symmetry plane, i. e., a two-dimensional flow, with blunt nose, angle of attack (a = 19.2°) and deflected body flap (S = 5° to 30°) was simulated with a thermal and chemical non-equilibrium Navier-Stokes/RANS solver for the Ыж = 9.9 flight at 51.9 km altitude. Laminar and turbulent flow, assuming transition at Reg2,tr/Me = 100 to 200, eq. (8.33), was computed. For turbulent flow a к — e model was employed.
The results are in short, with due reservations regarding the turbulent cases because of the problems associated with turbulence models in such flow situations:
— For laminar flow increasing flap deflection increases the pressure rise in the interaction region and the thermal loads.
— For laminar flow the flap effectiveness is only weakly affected by the surface temperature, it rises, also the thermal loads, up to S « 15° and then stays approximately constant.
— Turbulent flow rises the flap effectiveness beyond S « 15°, increasing also the thermal loads.
— For turbulent flow the flap effectiveness is significantly affected by the surface temperature.
These are results for a single two-dimensional re-entry case at already low speed and altitude. In the three-dimensional reality the flow field past a deflected control surface can be quite different, see, e. g., [30, 31], and the effect of the surface temperature may also be different at larger speeds and altitudes.
Of practical interest is the asymptotic behavior downstream of the strong – interaction region [14]. The interaction region usually is of small extent compared to the whole ramp or flap surface, see, e. g., the left part of Fig. 10.4 in Chapter 10. However, regarding the flap effectiveness the pressure distribution on the latter is of main interest. The problem of the high thermal loads in the interaction regime of course remains.
Example: Two-Dimensional Turbulent Flow. In view of CAV’s we close the section by looking at the problem of turbulence modeling for the computational simulation of control-surface flow in, e. g., [32, 33]. The ramp configuration chosen there has a rather large ramp angle (S = 38°) which leads to a very strong compression. The experimental data are from a gun tunnel operated with nitrogen [34]. The flow was computed with several two-equation turbulence models with a variety of length scale and compression corrections. Perfect gas was assumed. The flow parameters are given in Table 9.3.
|
Table 9.3. Flow parameters of the turbulent ramp computation case [32].
|
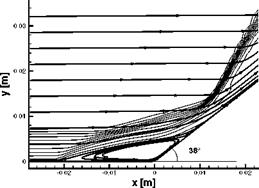
The computed flow field in Fig. 9.9 exhibits well the separation shock ahead of the recirculation regime, and the final reattachment shock.
|
Fig. 9.9. Computed Mach number isolines and streamlines in the interaction region of a 38° ramp configuration [32]. Turbulent flow, low Reynolds number к — ш model. |
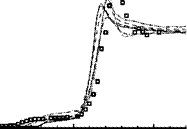
The computed surface pressure in general rises too late (separation shock) and thus indicates the primary separation too much downstream, Fig. 9.10. None of the turbulence models reaches the measured peak pressure, however the pressure relaxation behind it to the inviscid pressure level pw/p« 58.8 is sufficiently well met by all turbulence models. See in this regard also Chapter 6 of [14].
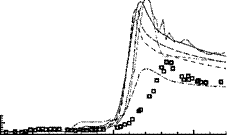
The computed heat transfer in the gas at the wall initially rises for all turbulence models also too late, but then—at the corner point—much too early and too high compared to the experimental data, Fig. 9.11.
Only one model comes close to the measurements. Although this is a very demanding case, the results are very unsatisfactory. In practice, however,
![]()
|
|
||
|
|||
|
|
||
|
|||
|
|||
|
|||
|
|||
|
|
||
|
|||
|
![Ramp-Type (Edney Type VI and V) Interaction Подпись: Fig. 9.12. Plan view of the HALIS configuration with the sketch of the type VI shock/shock interaction [36].](/img/3130/image726_4.gif) |
 layer. The sketch to the left shows the type VI interaction of the bow shock with the embedded wing shock.
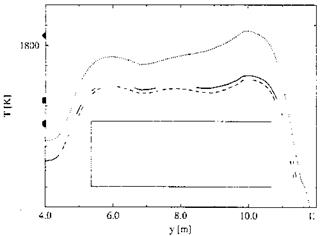
Computed radiation-adiabatic temperatures along the leading edge of the wing’s second delta are given in Fig. 9.13 for different catalytic wall models. The fully catalytic wall gives, as expected, the highest radiation-adiabatic temperatures and the non-catalytic wall the smallest with the results for the finite catalytic wall lying just above the latter.
![]()
![]()
![]()
![]() 2000
2000
2.0
Fig. 9.13. Computed radiation-adiabatic temperatures T(y) (= Tra(y)) along the wing’s leading edge of the HALIS configuration [36].
![]() The fully catalytic wall has kind of a temperature plateau lying mostly below the stagnation point value, whereas for the other catalytic wall models the temperature plateaus lie above the temperature at the stagnation point.
The fully catalytic wall has kind of a temperature plateau lying mostly below the stagnation point value, whereas for the other catalytic wall models the temperature plateaus lie above the temperature at the stagnation point.
At the end of the leading edge of the first wing delta (y = 4 m) the temperatures are approximately 400 K lower than those plateau temperatures. At y « 6 m for each catalytic model a small temperature maximum is discernible which is due to the shock/shock interaction.[162] At y « 10 m for each catalytic wall model a second maximum is present, which is attributed to the impingement of the slip surface on the leading edge. These maxima are as high or even higher than the appendant stagnation point values!
Example: Axisymmetric Laminar Flow. A proper modeling of high – temperature real-gas effects is necessary in any case, as we see in Fig. 9.14 [37]. The axisymmetric hyperboloid-flare configuration has been derived for validation purposes from the HERMES 1.0 configuration at approximately 30° angle of attack [38]. The computations in [37] were made with different gas models for the flight situation with the flow parameters (laminar flow) given in Table 9.4.
|
Table 9.4. Flow parameters of the shock/shock interaction study on the hyperboloid-flare configuration [37].
|
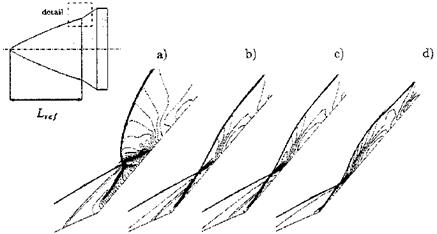
The use of different high-temperature real-gas models results in different interaction types over the flare, which has an angle 5 = 49.6° against the body axis. This is due to the different shock stand-off distances at the blunt nose of the hyperboloid-flare configuration. We have noted in Sub-Section
6.4.1 that the stand-off distance A0 is largest for perfect gas and becomes smaller with increasing high-temperature real-gas effects.
At the left side of Fig. 9.14 the perfect-gas result is given, case a). In this case the bow shock lies most forward and its intersection with the ramp shock results in a type V interaction. Fully equilibrium flow gives the most aft position of the bow shock (smallest bow-shock stand-off distance, SubSection 6.4.1) which results in a type VI interaction, case d). In between lie the other two models which also lead to type VI interactions, cases b) and c). Of course the wall pressure and the heat flux in the gas at the wall vary strongly from case to case, the fully equilibrium case giving the largest surface loads, see also [39].
|
Fig. 9.14. Influence of the modeling of high-temperature real-gas effects on the shape of the interaction region and the pressure distribution (isobars) on the hyperboloid-flare configuration (upper left) [37]: a) perfect gas, b) thermal and chemical non-equilibrium, c) thermal equilibrium and chemical non-equilibrium, d) thermal and chemical equilibrium. |
The influence of high-temperature real-gas effects on interaction phenomena is one issue of concern. While the interaction locations in some instances, e. g., at inlet cowl lips and engine struts, are more or less fixed, they shift in the case of wings and stabilizers strongly with the flight Mach number, and the flight vehicle’s angles of attack and yaw.[163] The understanding of all aspects of interaction phenomena, the prediction of their locations and their effects on an airframe therefore are very important.


