Shock waves and pressure distribution
It has already been stated that at the shock stall, as at the high incidence stall, there are sudden changes both in lift and drag; and it is only to be expected that these are due in the main to changes in the pressure distribution over the wings or other surfaces. So pressure plotting has been as important a feature of research into the problems of high-speed flight as into those of subsonic flight, and the connection between the shock patterns and pressure distribution is naturally of great interest and importance.
It must be remembered that when we were originally considering the shapes of aerofoil sections in Chapter 3, the so-called laminar flow aerofoil (Fig 3.22)
proved of great value at speeds of 140 m/s upwards. The characteristics of this section were comparative thinness and gently graduated camber, with the point of maximum camber farther back than on slow-speed types. As a result of this shape – in fact it was the purpose of it – the airflow speeded up very gradually and the distribution of decreased pressure over the upper surface was much more even than for the slower types on which there was a marked peak of suction quite near the leading edge (Fig. 3.8). We naturally approached the transonic region with aerofoil sections of this type, and so in considering the pressure distribution diagrams we must expect a fairly even distribution of decreased pressure on the top surface before the shock waves appear (this will be evident in Figs 11.13 and 11.14, overleaf).
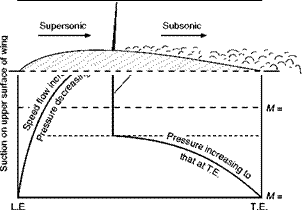
Figure 11.13 shows in a very realistic way how the decrease in pressure, or suction, on the upper surface of a wing is affected by the formation of a shock wave when the wing as a whole is moving near the critical Mach Number. It shows the local Mach Number of flow across the surface of the wing; pressure of course depends on the speed, and hence Mach Number; the higher the local speed the less the pressure (back to Bernoulli again). The pressure scale is not given since compressibility effects complicate the issue considerably, but qualitatively Figure 11.13 gives the right idea.
 |
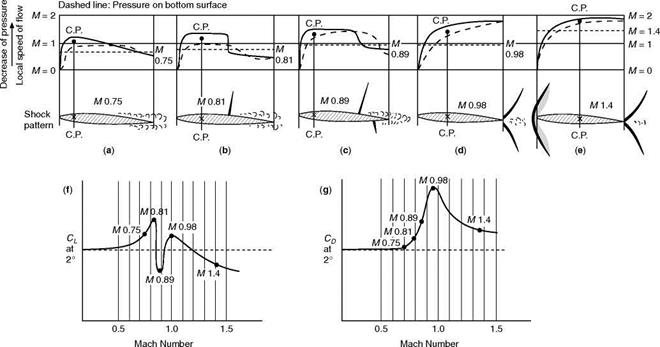
Figure 11.14 is rather more complicated, but it is worth trying to understand because it demonstrates so clearly the practical effect of the shock waves on the pressure distribution – this time on both top and bottom surfaces, and for a symmetrical wing section at a small angle of attack – and the resultant effect on the lift and drag coefficient of the wing over the transonic range.
Fig 11.13 Shockwave and pressure distribution
|
|
Fig 11.14 Shock-wave patterns and pressure distribution Symmetrical bi-convex section at 2° angle of attack.
Incidentally, too, the figure gives a partial answer to the exercise suggested at the end of the previous paragraph, but perhaps the reader tackled that exercise before reading on!
At (a), (b), (c), (d), and (e) in the figure, which illustrate what happens at Mach Numbers of 0.75, 0.81, 0.89, 0.98, and 1.4 respectively, we see first the shock patterns at these speeds. All refer to a symmetrical bi-convex aerofoil section at an angle of attack of 2°. Above the shock pattern is shown the corresponding Mach Number distribution, across the chord; the full line representing the upper surface and the dotted line the lower one; decreased pressure is indicated upwards, as this corresponds to increasing Mach Number. It is the difference between the full line and the dotted line which shows how effective in providing lift is that part of the aerofoil section; if the dotted line is above the full line the lift is negative. The total lift is represented by the area between the lines, and the centre of pressure by the centre of area. Increasing speed, which is proportional to the decreasing pressure, is also shown upwards.
On the vertical scale on each diagram is a Mach Number of 1, i. e. the speed of sound, and the free stream Mach Number, i. e. the Mach Number at which the aeroplane as a whole is moving through the air. Thus we can see at a glance over what parts of the surfaces, upper or lower, the local airflow is subsonic or supersonic, and over what parts its speed is above or below that at which the aerofoil is travelling.
Parts (f) and (g) of the figure show the lift coefficient and drag coefficient corresponding to each diagram. Of these the lift curve is most interesting, partly because we have already seen the drag curve in Fig. 11.7, but more because the drag is not revealed by the pressure distribution to the same extent as the lift is, and in fact the pressure distribution does not show the important part of the drag that is tangential to the surface at all.
Figure 11.14 should be studied at leisure; it tells a long story – too long for me to point out every detail. But let us just look at some of the more important points.
Part (a) of course, is the subsonic picture, except that separation has already become apparent near the trailing edge and there is practically no net lift over the rear third of the aerofoil section; the centre of pressure is well forward and, as (f) shows, the lift coefficient is quite good and is rising steadily; the drag coefficient, on the other hand, is only just beginning to rise.
In (b) the incipient shock wave has appeared on the top surface; notice the sudden increase of pressure (shown by the falling line) and decrease of speed at the shock wave. The centre of pressure has moved back a little, but the area is large, i. e. the lift is good (see (f)), and the drag (g) is rising rapidly.
The pressure distribution in (c) shows very clearly why there is a sudden drop in lift coefficient (see (f)) before the aerofoil as a whole reaches the speed of sound; on the rear portion of the wing the lift is negative because the suction on the top surface has been spoilt by the shock wave, while there is still quite good suction and high-speed flow on the lower surface. On the front portion there is nearly as much suction on the lower surface as on the upper. The centre of pressure has now moved well forward again; the drag is increasing rapidly (g).
Part (d) is particularly interesting because it shows the important results of the shock waves moving to the trailing edge, so no longer spoiling the suction or causing separation. The speed of flow over the surfaces is nearly all supersonic, the centre of pressure has gone back to about half chord, and owing to the good suction over nearly all the top surface, with rather less on the bottom, the lift coefficient has actually increased (see (f)). The drag coefficient is just about at its maximum.
At (e) we are through the transonic region. The bow wave has appeared. For the first time the speed of flow over about half of both surfaces is less than the Mach Number of 1.4 of the aerofoil as a whole. The lift coefficient has fallen again, because the pressures on both surfaces are nearly the same; and this time – for the first time since the critical Mach Number – the drag coefficient has fallen considerably.


