Supercritical Wing at Cruising Speed
Using porphyrin-based PSPs (FIB, Uni-Coat, Sol-gel, FEM, and PAR paints), Mebarki and Le Sant (2001) studied the pressure fields on the supercritical wing of a Dash 8-100 aircraft model at the cruising Mach number 0.74. Experiments were conducted in a blow-down pressurized tri-sonic wind tunnel at the Institute for Aerospace Research (IAR) of National Research Council (NRC) in Canada. At Mach 0.74, the total pressure of flow was changed from 1.4 bar to the maximum value of 3.1 bar, and accordingly the unit Reynolds number from 18.7 to 49 millions/m. The duration of a run depended on the Mach number and total pressure p0. At Mach 0.74, the run duration varied from 11 seconds at Rec = 8.51×10⁶ and p0 = 3.14 bar to 37 seconds at Rec = 3.81×10⁶ and p0 = 1.41 bar, where Rec is the Reynolds number based on the mean chord. The start-up time to establish stable flow was 2 seconds. The supercritical wing without a nacelle had a zero swept angle at the 60% chord line. The steel wing with an aluminum half fuselage was mounted on an external sidewall balance. The overall length, wingspan and mean chord of the model were 1.73, 1.1 and 0.203 m, respectively. The airfoil sections were designed to sustain extensive laminar flow on the surface. The wing was equipped with four rows of 32 pressure taps (stations A, B, C and D), which were located at 11%, 27%, 35% and 57% of the wingspan, respectively.
The ceiling of the test section was equipped with 20 optical windows. To provide fairly uniform and stable illumination, 16 cooled green halogen lamps (Iwasaki JY 1562 GR/N/CG 50W) with filters (color filter KOPP 4-96) were used for all the PSP formulations since they used the same porphyrin molecule (PtTFPP) as a probe. A 12-bit CCD Photometrics camera (1024×1024 pixels) and an Infrared Agema 900 camera (136×272 pixels) were mounted in the plenum shell. The CCD camera, equipped with two interference filters (Andover 650FS40 and Melles Griot 03FIB014) in parallel, recorded the luminescent emission of PSP from the wing root (station A) to approximately 85% of the wingspan. The infrared camera focused on three rows of taps (from station B to D), thus covering 30% of the wingspan. Of the porphyrin-based (PtTFPP) PSP formulations used, the PAR PSP from IAR and FEM PSP from NASA Langley were not commercially available, and three other paints, the FIB PSP, Sol-gel PSP and UniCoat PSP, were commercially produced by Innovative Scientific Solutions Inc. (ISSI) in Dayton, Ohio.
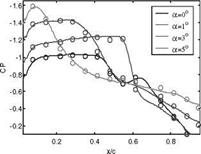
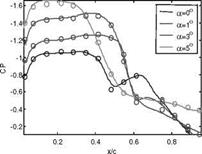
Figure 9.26 shows a comparison of pressure results obtained using the FIB PSP with the pressure tap data at the spanwise stations B (27% wingspan) and C (35% wingspan) for four angles of attack at Mach 0.74 and Rec = 3.8×10⁶, where in-situ calibration was applied. An average error in Cp was about 0.02, corresponding to 1.4% of the full pressure range at those locations. Figure 9.27 shows the distributions of Cp along with the corresponding temperature distributions obtained using an infrared camera for the angles of attack of 0, 1, 3 and 5 degrees at Mach 0.74 and Rec= 3.8×10⁶. A shock across which a rapid change of pressure occurred can be clearly identified in these PSP images. At the angle of attack of 5o, the wedge-like patterns at the spanwise stations C and D can be observed in the PSP images, which are associated with flow separation triggered by surface
imperfections near the leading edge of the wing. Fluorescent oil flow visualization on the surface confirmed this observation. As shown in Fig. 9.27, infrared thermography visualizes a surface temperature change induced by the flow separation at these stations and indicates that small turbulent wedges are generated by surface imperfections at the angles of attack of 0, 1 and 3 degrees. However, these turbulent wedges did not significantly alter the pressure distributions. In addition, using the Uni-Coat PSP, they studied the Reynolds number effect on the pressure distribution on the wing.
Mebarki and Le Sant (2001) evaluated the accuracy of PSP measurements at Mach 0.74 for all the PSP formulations through in-situ calibration. Table 9.1 summarizes the accuracy of the PSP results in terms of the absolute difference in Cp and the percentage error (%FS) over the full-scale range of Cp that is defined as the maximum range of Cp measured during a run on the wing upper surface by 39 pressure taps. The exposure times of the camera used for the PSP formulations are also listed in Table 9.1, depending on the luminescent intensity of a particular paint. Generally speaking, the accuracy was fairly good for all the PSPs at different Reynolds numbers despite their different temperature sensitivities, because a temperature variation over the wing chard during a run was relatively small (less than 2oC).
|
Table 9.1. Absolute and relative accuracy of PSP formulations in Cp
|
 |
 |
Station B Station C
Fig. 9.26. Comparison of PSP results (lines) obtained using the FIB PSP with pressure tap data (circles) at M = 0.74 and Rec= 3.8×10⁶. From Mebarki and Le Sant (2001)


