The wave-number frequency spectrum
In this section the main characteristics of the wall pressure spectrum are briefly reviewed. First, the scaling properties of the frequency spectra are discussed taking into account the most relevant experimental investigations conducted in the last 50 years. Then, illustrative examples of statistical models of the wavenumber-frequency spectrum are revised starting from the early Corcos’ idea up to the most recent developments.
Scaling of the frequency spectra Due to the complex structure of the turbulent boundary layer, it is not possible to obtain a single scaling that leads to a satisfactory collapse of experimental or numerical frequency spectra Фр(w). As will be clarified below, it is possible to normalize the spectra using inner or outer variables, and a universal collapse can be obtained in various regions of the pressure spectra separately [see, among many, the early work by Willmarth (1975) and the papers by Keith, Hurdis & Abraham (1992), Farabee & Caserella (1991) and Goody et al. (1998)]. This is due to the fact that the wall pressure is influenced by velocity fluctuations from all parts of the boundary layer and because the convection velocity depends strongly upon the distance from the wall, as a result of the nonuniform mean velocity distribution.
For an incompressible flow, the wall pressure can be written in the form of a Poisson’s equation,
V2 p(x, t) = q(x, t) (42)
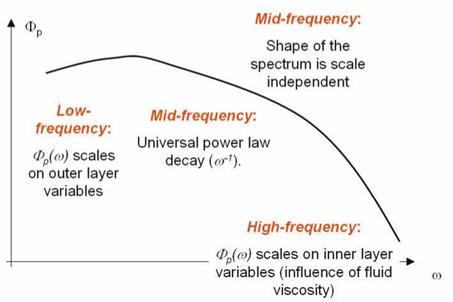
where q(x, t) represents the source terms. As suggested by Farabee & Caserella (1991), the analysis of the solution of the above equation in the Fourier domain, shows that the contributions to the high-frequency portion of the spectrum has mainly to be attributed to turbulence activity located in the near wall region while contributions to the lower-frequency portion can originate from activities throughout the boundary layer. Following this physical picture, and the conjectures suggested by Bradshaw (1967) and Bull (1979), it is possible to divide Фр(ш) into three main regions, depending on the frequency magnitude. At low frequencies, Фр(ш) scales on outer layer variables; at high frequencies, Фр(ш) is influenced by the fluid viscosity and thus it scales on inner variables; at intermediate frequencies, the shape of the spectrum is scale independent and an universal power law decay of the type ш-1 is expected.
Measurements of the cross-spectral densities [e. g. Bull (1967) and Farabee & Caserella (1991)] confirm that the pressure field can be divided into two distinct families, one associated with the motion in the outer layer and the other with motion in the inner layer. This separation occurs at the frequency where the auto-spectrum exhibit its maximum value. This frequency separates the non-universal from the universal scaling regimes of the frequency spectrum.
More precisely, in the low frequency region, different outer scalings have been identified. Keith, Hurdis & Abraham (1992) suggests to scale the frequency using U (the free stream velocity) and S*, whereas the amplitude of the pressure spectrum can be scaled through the free stream based dynamic pressure q. Other authors [including Farabee & Caserella (1991)] recommend a more effective scaling using tW instead of q. They suggest to scale the frequency upon U/S and the dimensionless spectrum to be of the form фР (^)u/tW s.
In the high frequency region, there is a more general consensus on the most effective scaling that is achieved through the variables UT, v and tW. This implies that the dimensionless frequency is uv/UT and the dimensionless spectrum should be ФР(u)U2/tW.
The universal region can be interpreted as an overlap of the two regions described above. In this part of the spectrum it is assumed шФР(u)U/tW = constant, thus leading to the ш-1 scaling. A precise definition of the amplitude of the frequencies bounding the universal region can be found in Bull (1979) and Farabee & Caserella (1991).
An additional range at very low frequencies has been also identified by some authors. Farabee & Caserella (1991) determine this region at uS*/U < 0.03 and they collapsed the spectrum using the normalization ФР(u)U/q2S*. In the very low frequency region they observed the spectrum to scale as ш2. This form of scaling is in agreement with the prediction given by the Kraichnan-Phillips theorem [Kraichnan (1956) and Phillips (1956)] which suggests that the wavenumber spectrum should scale like k2 as k ^ 0. According to the theoretical developments of e. g. Lilley & Hodgson (1960), this conclusion can be extended to the frequency spectrum under the hypothesis of low Mach number flow conditions.
In Figure 5 a scheme summarizing the expected scalings is reported.
|
Figure 5. Sketch clarifying the expected scaling regions of a typical wall pressure auto-spectrum. |
We refer to the literature [in particular Farabee & Caserella (1991) and Bull (1996)] for further discussions on the above topics and considerations about the scaling of the pressure variance.
Modeling the wavenumber-frequency spectrum According to the above discussion, several models have been proposed in the literature to reproduce the shape of the frequency auto-spectrum using suitable fits of experimental data. Here we only cite some of them as illustrative examples of common approaches. We refer to the literature for comprehensive reviews.
An early and widely used model was proposed by Corcos (1964). He gives the following representation of the frequency auto-spectrum:
C for ш < jjf
фрН = (43)
C for ш > j
The quantity C is a dimensionless constant and U is the external velocity. Note that for ш > Ц – the model correctly predicts the power law decay of the spectrum of the form ш-1.
An example, among many, explaining the way the Corcos’ early model has been successively modified, is given by Cousin (1999). This more general approach leads to the following expression:
( 2.14 x 10⁻⁵B for ш5*/ие < 0.25
Фр(ш) = і 7.56 x 10⁻⁶B (w5*/U)-0’75 for 0.25 < w5*/Ue < 3.5 (44)
[ 1.27 x 10⁻⁴B (ш5*/и)-3 for u5*/Ue > 3.5
where B = q2S*/U.
Other formulations worth mentioning are those by Efimtsov (1986) and Chase (1987, 1991). We refer to the literature for the details.
As pointed out above, the knowledge of the frequency spectrum is not sufficient to determine the modal excitation term of a plate subject to the turbulence induced pressure filed. This quantity is directly related to the shape of the complete wavenumber-frequency spectrum of the wall pressure field. The knowledge of Фр(к1,к2,ш) is therefore fundamental to compute the response of a surface panel subject to the action of the random pressure load.
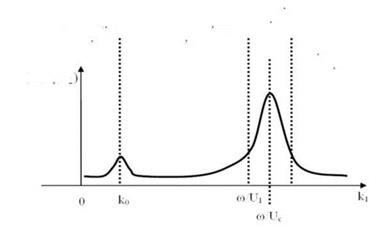
As pointed out by Bull (1996), the highest spectral levels of the pressure fluctuations are associated to the mean flow convection and, in the wavenumber spectrum, are centered on a wavenumber к1 = u/Uc, к1 along the free stream velocity. This part of the spectrum is often referred to as the convective ridge. For к1 ^ ш/Uc the spectrum is expected to be independent of the wavenumber. Another important aspect is related to the so-called sonic wavenumber к0 = ш/c. According to Blake (1986), for к = к0 an apparent singularity is present in the spectrum. However, in real flows, the wavenumber-frequency spectrum is expected to have a local finite peak in the vicinity of к0. These are among the main features that an analytical model attempting to predict the Фр(к1,к2,ш) shape, have to reproduce correctly.
One of the most reliable model developed in literature is again the early approach proposed by Corcos (1964) and based on the Fourier transform of a curve fit of measured narrow band pressure correlations. According to extensive experimental measurements [namely Willmarth (1975) and Bull (1967)], the cross-spectral density Гр(^1 ,&,ш) can be represented as:
Гр(£і,6,ш) = Фр(ш) A^i/Uc) B(ub/Uc) /Uc (45)
where
A(w£i/Uc) = е-аіІША/и and B(u&/Uc) = e-a2^l/U
 Фр( (o. ki. k-*
![]()
Figure 6. A scheme representing the wavenumber-frequency spectrum as a function of wavenumber, at constant frequency (scheme adapted from Blake (1986)).
Іоц Фр(со. к|.к:)
supersonic
region
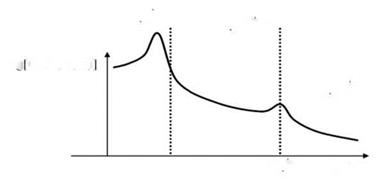
Figure 7. A scheme representing the wavenumber-frequency spectrum as a function of frequency, at constant wavenumber (scheme adapted from Blake (1986)).
whereas Uc is the convection velocity and a1 and a2 are parameters chosen to yield the best agreement with experiments. Various values are given in the literature. The typical range of the values is a1 = 0.11 + 0.12 and a2 =0.7 + 1.2 for smooth rigid walls.
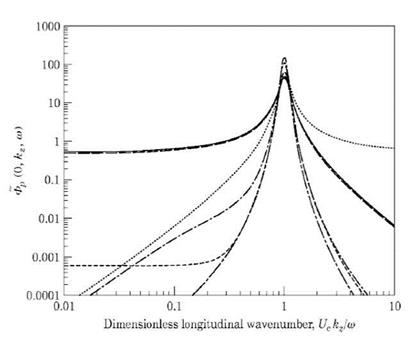
Unfortunately, only few experimental or numerical data concerning direct measurements of the wavenumber-frequency spectrum are available in the literature [Abraham (1998), Choi & Moin (1990), Panton & Robert (1994), Farabee & Geib (1991), Hwang & Maidanik (1990), Manoha (1996)]. However, it appears evident that a big spread is present in the low wavenumber range and that the Corcos model overpredicts levels at wavenumbers below the convective peak. This point is crucial for many applications, in particular in the case of underwater and surface marine vehicles and for aeronautical structures above the aerodynamic coincidence frequency [see also Ciappi et al. (2009)]. Later workers used analytical or quasi analytical approaches, or revised versions of the Corcos approach, in attempts to describe this region more accurately [see e. g. Graham (1997) for details].
 |
||
Most of the models proposed continued to follow the philosophy of the Corcos approach that can be generalized as follows. A first common feature of those empirical models is the separation of variables approach to represent the correlation function dependence on the streamwise separation £i and the crossflow separation £2. This is known as the ‘multiplication hypothesis’ in which the coherence of the cross-spectral density for an arbitrary separation direction is formed by the product of the cross-spectral densities for streamwise and spanwise separations, respectively. The axisymmetry of the geometry and of the flow is usually not explicit in those formulations but it is accounted for through the adjustable coefficients. According to the Corcos idea given in Eq. 45, most of the models suggest to take exponential decaying form of the functions A and B,
where L1 and L2 are the so-called coherence lengths in the streamwise and spanwise direction respectively.
The main advantage of adopting the expression given in Eqs. 45 and 46 is that the auto-spectrum part is decoupled from the cross-spectrum part. That implies that any choice for modeling the function Фр(ш), as those described above, can be addressed independently of any choice for representing the functions Li and L2.
As for auto-spectra, Cousin modified the Corcos model yielding the fol-
 |
||||
lowing expressions of the coherence lengths:
where Uc = 0.75U, bM = 0.756, bT = 0.378. a1 = 0.115 for smooth walls and 0.32 for rough walls, whereas a2 = 0.32 in all cases.
A similar model, not reported here for brevity, has been proposed by Cockburn & Robertson (1974). Wu & Maestrello (1995) proposed a model where the flow is assumed semi-frozen and decaying in space and time at a constant velocity Uc. After performing a comprehensive set of experimental results of wind tunnel testing, they defined an ensemble average of the cross correlation for the pressure fluctuation due to the turbulent boundary layer in which the effects of the Reynolds number and the boundary layer thickness were included.
Other models proposed by Chase (1980), Efimtsov (1982), Ffowcs Williams (1982), Chase (1987) and Smol’yakov & Tkachenko (1991) are compared in Graham (1997) and a plot reporting the spectra predicted by different models is given in Figure 8. It is shown that even at the convective peak, a relevant scattering among the model predictions is evident. Even larger scattering is observed in the estimation of the radiated sound as reported in the same paper.
The best model for high speed aircraft is, according to Graham, the one which provides an accurate description of the convective peak. Efimtsov’s model, an extension of Corcos model, is cited as a suitable candidate. For the sake of completeness, we report in the following the Efimtsov idea:
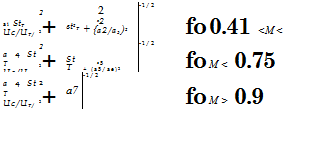
![]()
 L1
L1
L2
L2
In this model Uc = 0.75Ue and StT = w6/UT is a Strouhal number defined on the friction velocity. Averaged values of the empirical constants are ai = 0.1, a2 = 72.8, a2 = 1.54, 0,4 = 0.77, 0,5 = 548, a6 = 13.5, a =
5.66. It can be shown that at high frequencies, these expressions correspond to a Corcos model with a1 =0.1 and a2 = 0.7. Even though the number of
empirical constants is relevant, the model is extensively used thanks to the introduction of the Mach number as a relevant parameter.
|
Figure 8. Wavenumber frequency spectra computed at a fixed frequency as reported in Graham (1997). The spectra are computed as functions of the longitudinal wavenumber non-dimensionalized on the convective wavenumber ш/Uc (courtesy of JSV). |
More recently, Singer (1996a) and Singer (1996b) performed a Large – Eddy Simulation (LES) of a turbulent boundary layer at relatively high Reynolds number and proposed a model that overcomes the ‘multiplication hypothesis’ that is the basis of all the models based on the Corcos’ philosophy. His approach is based on an accurate fit of the two-dimensional coherence and therefore is particularly efficient for the determination of the off-axis coherences.
To the best of our knowledge, the most recent model proposed in literature is the one presented by Finneveden et al. (2005). They suggested a modified version of the Corcos and of the Chase model, thus going back to the ‘multiplication hypothesis’. They demonstrated that it is possible to find for both models a complete set of free parameters that provide a fair agreement with experimental data. The key point was to modify the Corcos model by introducing a frequency and flow speed dependence in the parameters and to introduce two new parameters in the Chase model to better fit the spanwise coherence to measurements.


