Type-2 Interactions: Close Wake-Surface Interactions
Figure 11.13(b) shows a second type of pressure signature found on a body situated below a rotor, which is distinctive because of its “saw-tooth” type of waveform. This second type of signature can occur at different points on the rear of the body under a variety of
combinations of thrust and advance ratio; it is related to the proximity, trajectory, and convection velocity of the trailed tip vortices relative to the body surface. The prediction of these airloads, therefore, requires a knowledge of the rotor wake structure, and specifically the strengths, induced velocity field, and trajectories of the convecting blade tip vortices. As shown in Chapter 10, this is a much more difficult problem, even for an isolated rotor. For the results shown in Fig. 11.13(b) the tip vortices were found to be close to the measurement point, but were a small distance above the body surface and not directly impinging at this point. Therefore, these pressure signatures are called close wake-surface interactions or Type-2 interactions..
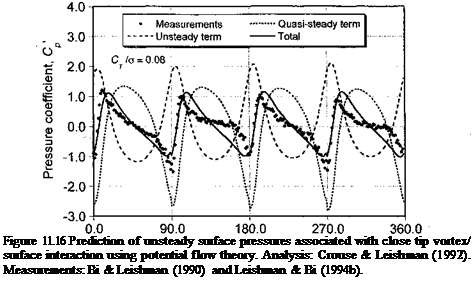
Of course, the actual pressure signature induced on the body by the wake depends not only on the relative speed, direction of, and proximity of the tip vortices to the measurement location, but also on their strength (i. e., tip vortex strength is proportional to rotor thrust – see Eq. 3.112). This problem can also be examined, albeit approximately, using potential flow theory. The simplest model consists of an infinite series of free vortices convecting at velocity fxQR at a skew angle x relative to the vertical (see Fig. 3.28). Again, an image system is included to satisfy the condition of flow tangency on the body surface. The unsteady pressure coefficient on the body induced by this model of the convecting wake is given as a function of xjs by
quasi-steady term
unsteady term
where К reflects the effect of rotor thrust and blade loading, as given by Eq. 11.4.
The first term in Eq. 11.5 is the quasi-steady contribution, and the second term is the unsteady effect, with the results being shown in Fig. 11.16. It can be seen that the predicted pressure signature is in excellent qualitative agreement with the measurements. This level of correlation essentially confirms that this second type of pressure signature is induced by the relatively close proximity of the convecting tip vortices to the fuselage surface. It should be noted, however, that, compared to the blade passage effect shown in Fig. 11.16, in this case both the quasi-steady term and the unsteady term are of equal importance in determining the net form of the unsteady pressure response.
Crouse et al. (1992) have hypothesized a large sensitivity of the unsteady pressure signature to hypothetical changes in the wake skew angle у (i. e., the height and trajectory of the convecting wake vortices over the body). At low wake skew angles the saw-tooth type of pressure signature induced on the body is clearly a Type-2 interaction (i. e., a close wake-surface interaction). However, when the wake skew angle is increased slightly, the induced pressure signature becomes more benign. In fact, the pressure signature at higher wake skew angles gradually becomes more like a blade-passage effect because the wake
Blade azimuth position (time), гр – deg.
 |
makes an increasingly shallow angle with the body surface as д increases for a constant value of rotor thrust – see Fig. 3.28.
In reality, of course, the trajectory of the rotor wake is not just a function of rotor thrust, but is affected by the distribution of loading over the rotor disk, the advance ratio, and the self-induced wake distortion, as well as the amount of local wake distortion caused by the fuselage. This latter effect increases the wake skew angle at the rear of the rotor and decreases the wake skew angle at the front of the disk. Therefore, it can be concluded that while an unsteady potential flow model is sufficient to predict the close wake-surface interactions when the vortex strengths and locations are prescribed, the high sensitivity of the body pressures to changes in wake location means that accurate prediction of the rotor wake geometry is really the vital key to successful prediction of rotor wake-airframe interactional airloads. Because it is difficult to predict (or measure) the wake geometry to high accuracy, this means that the accurate prediction (and measurement) of Type-2 interaction signatures at specific points on the airframe is still very challenging – see Wachspress et al. (2003) for a comprehensive study.


