Turbulence structure in the near-wall region
The dominance of the near-wall region in terms of turbulence kinetic energy and Reynolds shear stress motivated engineers to study it in more detail with a view to
 |
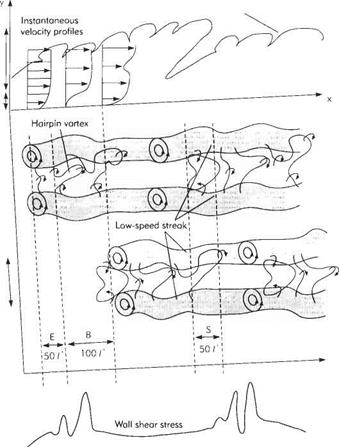
identifying the time-varying flow structures there. Kline etal[44] carried out a seminal study of this kind. They obtained hydrogen-bubble flow visualizations for the turbulent boundary layer. These revealed that streak-like structures develop within the viscous sub-layer. These are depicted schematically in Fig. 7.41. The streak-like structures are continuously changing with time. Observations over a period of time reveal that there are low – and high-speed streaks. The streak structures become less noticeable further away from the wall and apparently disappear in the law-of-the – wall region. In the outer region experiments reveal the turbulence to be intermittent and of larger scale (Fig. 7.41).
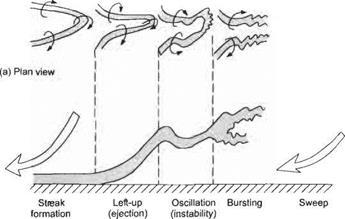
The conventional view is that the streaks are a manifestation of the existence of developing hair-pin vortices. See Figs 7.41 and 7.42 for a schematic illustration of the conceptual burst cycle of these structures, that is responsible for generating transient high levels of wall shear stress. The development of the ‘hair pin vortices’ tends to be quasi-periodic with the following sequence of events:
(i) Formation of the low-speed streaks: During this process the legs of the vortices lie close to the wall.
(ii) Lift-up or ejection: Stage E in Fig. 7.41. The velocity induced by these vortex legs tends to cause the vortex head to lift off away from the wall.
(iii) Oscillation or instability. The first part of Stage В in Fig. 7.41. A local point of inflexion develops in the velocity profile and the flow becomes susceptible to Helmholtz instability locally causing the head of the vortex to oscillate fairly violently.
(iv) Bursting or break-up: The latter part of Stage В in Fig. 7.41. The oscillation culminates in the vortex head bursting.
(v) High-speed sweep: Stage S in Fig. 7.41. After a period of quiescence the bursting event is followed by a high-speed sweep towards the wall. It is during this process that the shear stress at the wall is greatest and the new hairpin-vortex structures are generated.
It should be understood that Fig. 7.41 is drawn to correspond to a frame moving downstream with the evolving vortex structure. So a constant streamwise velocity is superimposed on the ejections and sweeps.
![]()
|
|
|
|
|
|
|
|
|

The events described above are quasi-periodic in a statistical sense. The mean values of their characteristics are as follows: spanwise spacing of streaks = 100u/Vt; they reach a vertical height of 50i//K[45]; their streamwise extent is about 1000v/V*; and the bursting frequency is about 0.004 V^/v. This estimate for bursting frequency is still a matter of some controversy. Some experts* think that the bursting frequency does not scale with the wall units, but other investigators have suggested that this result is an artefact of the measurement system.* Much greater detail on these nearwall structures together with the various concepts and theories advanced to explain their formation and regeneration can be found in Panton.*
|
(b) Side view Fig. 7.42 Schematic of the evolution of a hairpin vortex in the near-wall region |
Example 7.10 Determining specifications of a MEMS actuator for flow control Modern technology is rapidly developing the capability of making very small machines that, among many other applications, can be used for actuation and sensing in flow-control systems. Such machines are collectively known as MEMS (Micro-electro-mechanical Systems). The term is usually used to refer to devices that have characteristic overall dimensions of less than 1 mm but more than 1 pm. Such devices combine electrical and mechanical components that are manufactured by means of integrated circuit batch-processing techniques.[46]
A conceptual MEMS actuator for use as part of a flow-control system is depicted schematically in Fig. 7.43. This device consists of a diaphragm located at the bottom of a buried cavity that connects to the boundary layer via an exit orifice. The diaphragm would be made of silicon or a suitable polymeric material and driven by a piezoceramic driver. When a voltage is applied to the driver, depending on the sign of the electrical signal, it either contracts or expands, thereby displacing the diaphragm up or down. Thus, if an alternating voltage is applied to the diaphragm, it will be periodically driven up and down. This in turn will alternately reduce and increase the volume of the cavity, thereby raising then reducing the air pressure there. An elevated cavity pressure will drive air through the exit orifice into the boundary layer followed by air returning to the cavity when the cavity pressure falls. This periodic outflow and inflow creates what is termed a synthetic jet. Despite the fact that over a cycle there is no net air leaving the cavity, vortical structures propagate into the boundary layer, much as they would from a steady micro-jet. It is also possible to drive the diaphragm with short-duration steady voltage thereby displacing the diaphragm suddenly upward and driving a ‘puff of air into the boundary layer. f
Fig. 7.43 Schematic sketch of a jet-type actuator
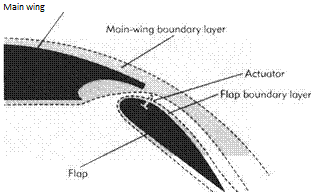
It has been proposed that synthetic-jet actuators be used to control the near-wall, streaklike, structures in the turbulent boundary layer over the flap of a large airliner. In particular, the aim is to increase the so-called bursting frequency in order to increase the level of turbulence. The increased turbulence level would be expected to lead to a delay of boundary – layer separation, allowing the flap to be deployed at a larger angle of incidence, thereby increasing its performance. The basic concept is illustrated in Fig. 7.44. The question to be addressed here is what dimensions and specifications should be chosen for the MEMS actuator in this application.
Consider an aircraft similar to the Airbus A340 with a mean wing chord of 6 m and a flap chord of 1.2 m. Assume that the approach speed is about 100 m/s and assume standard sea – level conditions so that the kinematic viscosity of the air is around 15 x 10-6m2/s. It is proposed to locate the array of MEMS actuators near the point of minimum pressure 200 mm from the leading edge of the flap. A new boundary layer will develop on the flap underneath the separated boundary layer from the main wing. This will ensure that the flap boundary layer is strongly disturbed provoking early transition to turbulence.
![]()
 |
„ _ xUe 0.2 x 100
 |
~ ” 15 x 10-6
Fig. 7.44
In a low-disturbance environment we would normally expect the boundary layer to be laminar at this Reynolds number (see Section 7.9), but the flap boundary layer is highly disturbed by the separated boundary layer from the main wing, ensuring early transition. Using Eqn (7.121) we can estimate the local skin-friction coefficient, i. e.
cf = (21og10(1.33 x 10⁶) – 0.65)-2’3 = 0.00356.
From this we can then estimate the wall shear stress and friction velocity, thus
The boundary-layer thickness is not strictly needed for determining the actuator specifications, but it is instructive to determine it also. In Eqn (7.71) it was shown that Cm = 2©(L)/L, i. e. there is a relationship between the coefficient of skin-friction drag and the momentum thickness at the trailing edge. This relationship can be exploited to estimate the momentum thickness in the present application. We merely assume for this purpose that the flap boundary layer terminates at the point in question, i. e. at x = 200 mm, so that
|
(1оё10Яе*)2-58 {logio(1.33 x 10«)} |
 |
|||
©M = ^Стіх).
0(x) =^Cdr(x) = x 0.00424 ~ 425 pm.
From Eqn (7.83)
0.424
![]() 0 = 0.09736 giving 6 = = 4.36 mm.
0 = 0.09736 giving 6 = = 4.36 mm.
This illustrates yet again just how thin the boundary layer actually is in aeronautical applications.
We can now calculate the wall unit and thence the other dimensions of interest.
Wall unit:
15 xl0“6
t=Vt=^.22-^3’5^’
Viscous sub-layer thickness:
5(.+ ~ 17.5 pm;
Average spanwise spacing of streaks:
100 ~ 350 pm;
Bursting frequency:
![]() V2 4.22
V2 4.22
0.004— = 0.004 X ———v v 3.5 x 10~6
This suggests that the spanwise dimensions of the MEMS actuators should not exceed about 100 pm; i. e. about 30 per cent of average spanwise streak spacing. They also need to be able to effect control at frequencies of at least ten times the bursting frequency, say 50 kHz.


