An Application of the Momentum Equation: Drag of a Two-Dimensional Body
We briefly interrupt our orderly development of the fundamental equations of fluid dynamics in order to examine an important application of the integral form of the momentum equation. During the 1930s and 1940s, the National Advisory Committee for Aeronautics (NACA) measured the lift and drag characteristics of a series of systematically designed airfoil shapes (discussed in detail in Chapter 4). These
measurements were carried out in a specially designed wind tunnel where the wing models spanned the entire test section; i. e., the wing tips were butted against both sidewalls of the wind tunnel. This was done in order to establish two-dimensional (rather than three-dimensional) flow over the wing, thus allowing the properties of an airfoil (rather than a finite wing) to be measured. The distinction between the aerodynamics of airfoils and that of finite wings is made in Chapters 4 and 5. The important point here is that because the wings were mounted against both sidewalls of the wind tunnel, the NACA did not use a conventional force balance to measure the lift and drag. Rather, the lift was obtained from the pressure distributions on the ceiling and floor of the tunnel (above and below the wing), and the drag was obtained from measurements of the flow velocity downstream of the wing. These measurements may appear to be a strange way to measure the aerodynamic force on a wing. Indeed, how are these measurements related to lift and drag? What is going on here? The answers to these questions are addressed in this section; they involve an application of the fundamental momentum equation in integral form, and they illustrate a basic technique that is frequently used in aerodynamics.
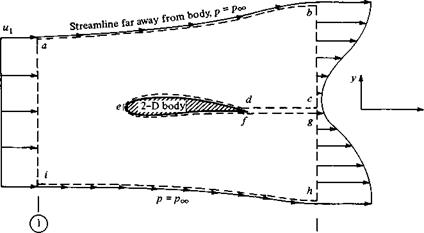
Consider a two-dimensional body in a flow, as sketched in Figure 2.18a. A control volume is drawn around this body, as given by the dashed lines in Figure 2.18a. The control volume is bounded by:
1. The upper and lower streamlines far above and below the body (ab and hi, respectively).
2. Lines perpendicular to the flow velocity far ahead of and behind the body (aі and bh, respectively).
3. A cut that surrounds and wraps the surface of the body (cdefg).
The entire control volume is abcdefghia. The width of the control volume in the z direction (perpendicular to the page) is unity. Stations 1 and 2 are inflow and outflow stations, respectively.
Assume that the contour abhi is far enough from the body such that the pressure is everywhere the same on abhi and equal to the freestream pressure p — px. Also, assume that the inflow velocity и is uniform across ai (as it would be in a freestream, or a test section of a wind tunnel). The outflow velocity u2 is not uniform across bh, because the presence of the body has created a wake at the outflow station. However, assume that both ni and n 2 are in the a direction; hence, ni = constantandn2 = /(y).
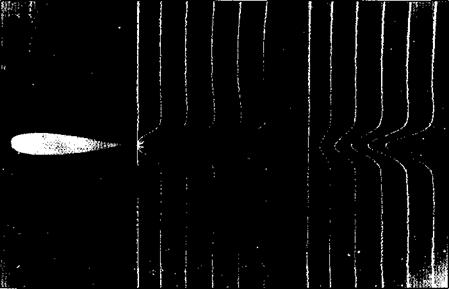
An actual photograph of the velocity profiles in a wake downstream of an airfoil is shown in Figure 2.18b.
Consider the surface forces on the control volume shown in Figure 2.18a. They stem from two contributions:
1. The pressure distribution over the surface abhi,
|
abhi |
2. The surface force on def created by the presence of the body
|
|
|
|
|
|
|
In the list on page 117, the surface shear stress on ab and hi has been neglected. Also, note that in Figure 2.18a the cuts cd and fg are taken adjacent to each other; hence, any shear stress or pressure distribution on one is equal and opposite to that on the other; i. e., the surface forces on cd and fg cancel each other. Also, note that the surface force on def is the equal and opposite reaction to the shear stress and pressure distribution created by the flow over the surface of the body. To see this more clearly, examine Figure 2.19. On the left is shown the flow over the body. As explained in Section 1.5, the moving fluid exerts pressure and shear stress distributions over the body surface which create a resultant aerodynamic force per unit span R’ on the body. In turn, by Newton’s third law, the body exerts equal and opposite pressure and shear stress distributions on the flow, i. e., on the part of the control surface bounded by def. Hence, the body exerts a force —R’ on the control surface, as shown on the right of Figure 2.19. With the above in mind, the total surface force on the entire control volume is
Moreover, this is the total force on the control volume shown in Figure 2.18a because the volumetric body force is negligible.
Consider the integral form of the momentum equation as given by Equation
(2.64)
. The right-hand side of this equation is physically the force on the fluid moving through the control volume. For the control volume in Figure 2.18a, this force is simply the expression given by Equation (2.73). Hence, using Equation (2.64), with the right-hand side given by Equation (2.73), we have
 |
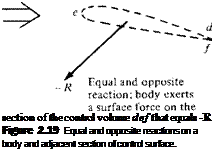 Flow exerts p and r on the surface of the body, giving a resultant aerodynamic force R
Assuming steady flow, Equation (2.74) becomes
Equation (2.75) is a vector equation. Consider again the control volume in Figure 2.18a. Take the x component of Equation (2.75), noting that the inflow and outflow velocities u and «2 are in the x direction and the x component of R’ is the aerodynamic drag per unit span D
In Equation (2.76), the last term is the component of the pressure force in the x direction. [The expression (p dS)x is the x component of the pressure force exerted on the elemental area dS of the control surface.] Recall that the boundaries of the control volume abhi are chosen far enough from the body such that p is constant along these boundaries. For a constant pressure.
![]() JJ(pdS)x= 0
JJ(pdS)x= 0
abhi
because, looking along the x direction in Figure 2.18a, the pressure force on abhi pushing toward the right exactly balances the pressure force pushing toward the left. This is true no matter what the shape of abhi is, as long as p is constant along the surface (for proof of this statement, see Problem 2.3). Therefore, substituting Equation (2.77) into (2.76), we obtain
[2.78]
s
Evaluating the surface integral in Equation (2.78), we note from Figure 2.18a that:
1. The sections ab, hi, and def are streamlines of the flow. Since by definition V is parallel to the streamlines and dS is perpendicular to the control surface, along these sections V and dS are perpendicular vectors, and hence V • dS = 0. Asa result, the contributions of ab, hi, and def to the integral in Equation (2.78) are zero.
2. The cuts cd and fg are adjacent to each other. The mass flux out of one is identically the mass flux into the other. Hence, the contributions of cd and fg to the integral in Equation (2.78) cancel each other.
As a result, the only contributions to the integral in Equation (2.78) come from sections ai and bh. These sections are oriented in the у direction. Also, the control volume has unit depth in the z direction (perpendicular to the page). Hence, for these sections,
dS — dy( 1). The integral in Equation (2.78) becomes
![]() ^ (pV • dS)n = – pjii] dy + p2udy
^ (pV • dS)n = – pjii] dy + p2udy
Note that the minus sign in front of the first term on the right-hand side of Equation (2.79) is due to V and dS being in opposite directions along ai (station 1 is an inflow boundary); in contrast, V and dS are in the same direction over hb (station 2 is an outflow boundary), and hence the second term has a positive sign.
terms of the known freestream velocity и and the flow-field properties p2 and u2, across a vertical station downstream of the body. These downstream properties can be measured in a wind tunnel, and the drag per unit span of the body D’ can be obtained by evaluating the integral in Equation (2.83) numerically, using the measured data for p2 and «2 as a function of y.
Examine Equation (2.83) more closely. The quantity u — u2 is the velocity decrement at a given у location. That is, because of the drag on the body, there is a wake that trails downstream of the body. In this wake, there is a loss in flow velocity и і — и 2. The quantity p2u2 is simply the mass flux; when multiplied by u — u2,
it gives the decrement in momentum. Therefore, the integral in Equation (2.83) is physically the decrement in momentum flow that exists across the wake, and from Equation (2.83), this wake momentum decrement is equal to the drag on the body.
For incompressible flow, p = constant and is known. For this case, Equation (2.83) becomes
/ Ґ
D’ = p І иг(и — u2)dy [2.84]
Jh
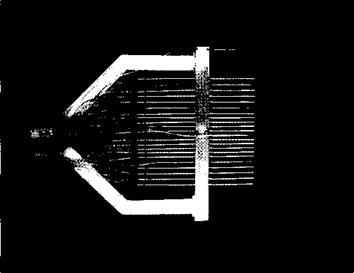
Equation (2.84) is the answer to the questions posed at the beginning of this section. It shows how a measurement of the velocity distribution across the wake of a body can yield the drag. These velocity distributions are conventionally measured with a Pitot rake, such as shown in Figure 2.20. This is nothing more than a series of Pitot tubes attached to a common stem, which allows the simultaneous measurement of velocity across the wake. (The principle of the Pitot tube as a velocity-measuring instrument is discussed in Chapter 3. See also pages 147-161 of Reference 2 for an introductory discussion on Pitot tubes.)
The result embodied in Equation (2.84) illustrates the power of the integral form of the momentum equation; it relates drag on a body located at some position in the flow to the flow-field variables at a completely different location.
At the beginning of this section, it was mentioned that lift on a two-dimensional body can be obtained by measuring the pressures on the ceiling and floor of a wind
|
Figure 2.20 A Pitot rake for wake surveys. (Courtesy of the University of Maryland Aerodynamic Laboratory.) |
tunnel, above and below the body. This relation can be established from the integral form of the momentum equation in a manner analogous to that used to establish the drag relation; the derivation is left as a homework problem.
Consider an incompressible flow, laminar boundary layer growing along the surface of a flat plate, with chord length c, as sketched in Figure 2.21. The definition of a boundary layer was discussed in Section 1.10 and illustrated in Figure 1.35. The significance of a laminar flow is discussed in Chapter 15; it is not relevant for this example. For an incompressible, laminar, flat plate boundary layer, the boundary-layer thickness 6 at the trailing edge of the plate is
S _ 5
C 4/Rc,
and the skin friction drag coefficient for the plate is
D’ 1.328
Cf = ———- = -=
<7ooC(l) VRe7
where the Reynolds number is based on chord length
![]()
![]() Рос Foe ( Poe
Рос Foe ( Poe
[Note: Both S/c and C/ are functions of the Reynolds number—just another demonstration of the power of the similarity parameters. Since we are dealing with a low-speed, incompressible flow, the Mach number is not a relevant parameter here.] Let us assume that the velocity profile through the boundary layer is given by a power-law variation
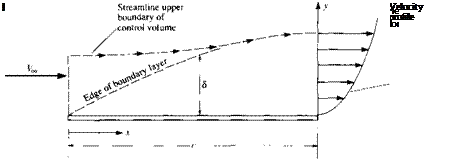 |
Calculate the value of n, consistent with the information given above.
Solution
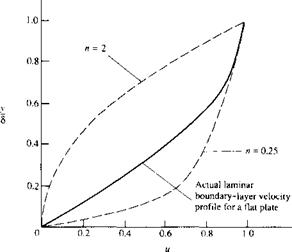
By assuming a power-law velocity profile in the form of и/V^, = (y/S)n, we have found two different velocity profiles that satisfy the momentum principle applied to a finite control volume. Both of these profiles are shown in Figure 2.22 and are compared with an exact velocity profile obtained by means of a solution of the incompressible, laminar boundary-layer equations for a flat plate. (This boundary-layer solution is discussed in Chapter 18.) Note that the result n = 2 gives a concave velocity profile which is essentially nonphysical when compared to the convex profiles always observed in boundary layers. The result n = 0.25 gives a convex velocity profile which is qualitatively physically correct. However, this profile is quantitatively inaccurate, as can be seen in comparison to the exact profile. Hence, our original assumption of a power-law velocity profile for the laminar boundary layer in the form of и/= (y/S)n is not very good, in spite of the fact that when n = 2 or 0.25, this assumed velocity profile does satisfy the momentum principle, applied over a large, finite control volume.
|
L=o Figure 2.22 Comparison of the actual laminar boundary-layer profile with those calculated from Example 2.2. |


