Applied Aerodynamics: the Flow over a Circular Cylinder—the Real Case
The inviscid, incompressible flow over a circular cylinder was treated in Section 3.13. The resulting theoretical streamlines are sketched in Figure 3.26, characterized by a
symmetrical pattern where the flow “closes in” behind the cylinder. As a result, the pressure distribution over the front of the cylinder is the same as that over the rear (see Figure 3.29). This leads to the theoretical result that the pressure drag is zero—d’Alembert’s paradox.
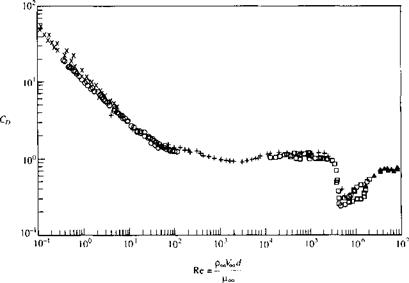
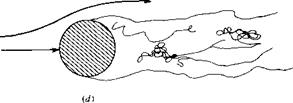
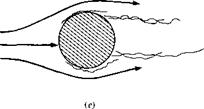
The real flow over a circular cylinder is quite different from that studied in Section 3.13, the difference due to the influence of friction. Moreover, the drag coefficient for the real flow over a cylinder is certainly not zero. For a viscous incompressible flow, the results of dimensional analysis (Section 1.7) clearly demonstrate that the drag coefficient is a function of the Reynolds number. The variation of Co = /(Re) for a circular cylinder is shown in Figure 3.44, which is based on a wealth of experimental data. Here, Re = (PooFoo^O/P-co. where d is the diameter of the cylinder. Note that Co is very large for the extremely small values of Re < 1, but decreases monotonically until Re ^ 300, 000. At this Reynolds number, there is a precipitous drop of CD from a value near 1 to about 0.3, then a slight recovery to about 0.6 for Re = 107. (Note: These results are consistent with the comparison shown in Figure 139d and e, contrasting С о for a circular cylinder at low and high Re.) What cause this precipitous drop in Co when the Reynolds number reaches about 300,000? A detailed answer must await our discussion of viscous flow in Part 4. However, we state now that the phenomenon is caused by a sudden transition of laminar flow within the boundary layer at the lower values of Re to a turbulent boundary layer at the higher values of Re. Why does a turbulent boundary layer result in a smaller Co for this case? Stay tuned; the answer is given in Part 4.
|
Figure 3.44 Variation of cylinder-drag coefficient with Reynolds number. (Source: Experimental data as compiled in Panton, Ronald, Incompressible Flow, Wiley-lnterscience, New York, 1 984.) |
The variation of Сд shown in Figure 3.44 across a range of Re from 10-1 to 107 is accompanied by tremendous variations in the qualitative aspects of the flow field, as itemized, and as sketched in Figure 3.45.
|
(el |
|
|
|
(0 |
|
|
|
Figure 3.45 Various types of flow over a circular cylinder. [Source: Panton, Ronald, Incompressible Flow, Wiley-lnterscience, New York, 1984.) |
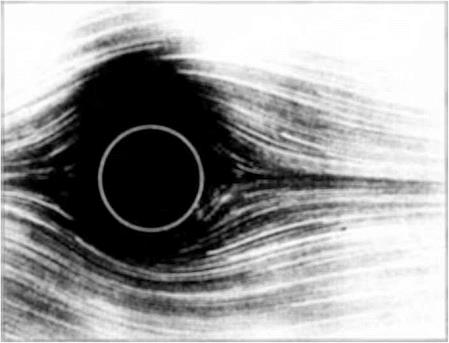
1. For very low values of Re, say, 0 < Re < 4, the streamlines are almost (but not exactly) symmetrical, and the flow is attached, as sketched in Figure 3.45a. This regime of viscous flow is called Stokes flow, it is characterized by a near balance of pressure forces with friction forces acting on any given fluid element; the flow velocity is so low that inertia effects are very small. A photograph of this type of flow is shown in Figure 3.46, which shows the flow of water around a circular cylinder where Re = 1.54. The streamlines are made visible by aluminum powder on the surface, along with a time exposure of the film.
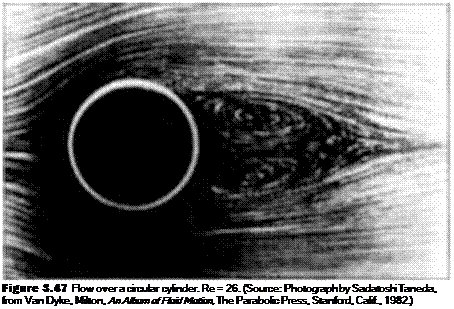
2. For 4 < Re < 40, the flow becomes separated on the back of the cylinder, forming two distinct, stable vortices that remain in the position shown in Figure 3.45b. A photograph of this type of flow is given in Figure 3.47, where Re = 26.
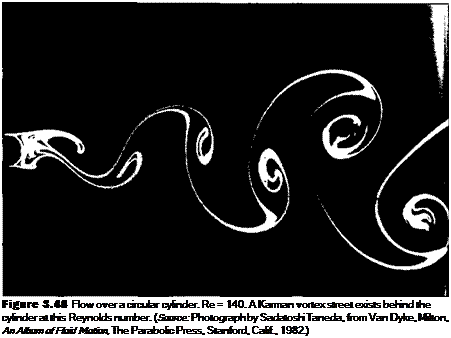
3. As Re is increased above 40, the flow behind the cylinder becomes unstable; the vortices which were in a fixed position in Figure 3.45b now are alternately shed from the body in a regular fashion and flow downstream. This flow is sketched in Figure 3.45c. A photograph of this type of flow is shown in Figure 3.48, where Re = 140. This is a water flow where the streaklines are made visible by the electrolytic precipitation method. (In this method, metal plating on the cylinder
|
Figure 3.46 Flow over a circular cylinder. Re = 1.54. (Source: Photograph by Sadatoshi Taneda, from Van Dyke, Milton, An Album of Fluid Motion, The Parabolic Press, Stanford, Calif., 1982.) |
surface acts as an anode, white particles are precipitated by electrolysis near the anode, and these particles subsequently flow downstream, forming a streakline. The definition of a streakline is given in Section 2.11) The alternately shed vortex pattern shown in Figures 3.45c and 3.48 is called a Karman vortex street, named after Theodore von Karman, who began to study and analyze this pattern in 1911 while at Gottingen University in Germany, (von Karman subsequently had a long and very distinguished career in aerodynamics, moving to the California Institute of Technology in 1930, and becoming America’s best-known aerodynamicist in the mid-twentieth century. An autobiography of von Karman was published in 1967; see Reference 49. This reference is “must” reading for anyone interested in a riveting perspective on the history of aerodynamics in the twentieth century.)
4. As the Reynolds number is increased to large numbers, the Karman vortex street becomes turbulent and begins to metamorphose into a distinct wake. The laminar boundary layer on the cylinder separates from the surface on the forward face, at a point about 80° from the stagnation point. This is sketched in Figure 3.45J. The value of the Reynolds number for this flow is on the order of 105. Note, from Figure 3.44, that Co is a relatively constant value near unity for 103 < Re < 3 x 10⁵.
5. For 3 x 10⁵ < Re < З X 106, the separation of the laminar boundary layer still takes place on’the forward face of the cylinder. However, in the free shear layer over the top of the separated region, transition to turbulent flow takes place. The
 |
flow then reattaches on the back face of the cylinder, but separates again at about 120° around the body measured from the stagnation point. This flow is sketched in Figure 3.45e. This transition to turbulent flow, and the corresponding thinner wake (comparing Figure 3.45e with Figure 3.45d), reduces the pressure drag on the cylinder and is responsible for the precipitous drop in Co at Re = 3 x 10⁵ shown in Figure 3.44. (More details on this phenomenon are covered in Part 4.)
6. For Re < 3 x 10⁶, the boundary layer transits directly to turbulent flow at some point on the forward face, and the boundary layer remains totally attached over the surface until it separates at an angular location slightly less than 120° on the back surface. For this regime of flow, CD actually increases slightly with increasing Re because the separation points on the back surface begin to move closer to the top and bottom of the cylinder, producing a fatter wake, and hence larger pressure drag.
In summary, from the photographs and sketches in this section, we see that the real flow over a circular cylinder is dominated by friction effects, namely, the separation of the flow over the rearward face of the cylinder. In turn, a finite pressure drag is created on the cylinder, and d’Alembert’s paradox is resolved.
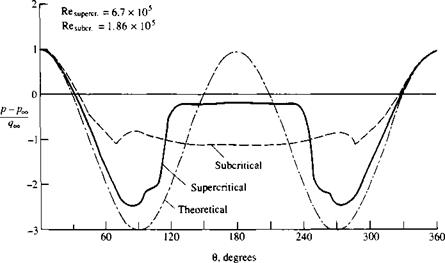
Let us examine the production of drag more closely. The theoretical pressure distribution over the surface of a cylinder in an inviscid, incompressible flow was given
|
Figure 3.49 Pressure distribution over a circular cylinder in low-speed flow. Comparison of the theoretical pressure distribution with two experimental pressure distributions—one for a subcritical Re and the other for a supercritical Re. |
in Figure 3.29. In contrast, several real pressure distributions based on experimental measurements for different Reynolds numbers are shown in Figure 3.49, and are compared with the theoretical inviscid flow results obtained in Section 3.13. Note that theory and experiment agree well on the forward face of the cylinder, but that dramatic differences occur over the rearward face. The theoretical results show the pressure decreasing around the forward face from the initial total pressure at the stagnation point, reaching a minimum pressure at the top and bottom of the cylinder (i9 — 90° and 270°), and then increasing again over the rearward face, recovering to the total pressure at the rear stagnation point. In contrast, in the real case where flow separation occurs, the pressures are relatively constant in the separated region over the rearward face and have values slightly less than freestream pressure. (In regions of separated flow, the pressure frequently exhibits a nearly constant value.) In the separated region over the rearward face, the pressure clearly does not recover to the higher values that exist on the front face. There is a net imbalance of the pressure distribution between the front and back faces, with the pressures on the front being higher than on the back, and this imbalance produces the drag on the cylinder.
Return to Figure 3.44, and examine again the variation of CD as a function of Re. The regimes associated with the very low Reynolds numbers, such as Stokes flow for Re «5 1, are usually of no interest to aeronautical applications. For example, consider a circular cylinder in an airflow of 30 m/s (about 100 ft/s, or 68 mi/h) at standard sea level conditions, where Poo = 1-23 kg/m3 and = 1.79 x 10“5 kg/(m • s). The smaller the diameter of the cylinder, the smaller will be the Reynolds number.
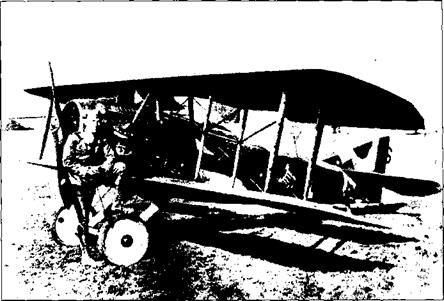
speed of the SPAD was 130 mi/h, or 57.8 m/s. For this velocity at standard sea level, we have
With this value of Re, we are beginning to enter the world of practical aerodynamics
![]()
|
for the flow over cylinders. It is interesting to note that, from Figure 3.44, Сд = 1 for the wires on the SPAD. In terms of airplane aerodynamics, this is a high drag coefficient for any component of an aircraft. Indeed, the bracing wires used on biplanes of the World War I era were a source of high drag for the aircraft, so much so that early in the war, bracing wire with a symmetric airfoil-like cross section was utilized to help reduce this drag. Such wire was developed by the British at the Royal Aircraft Factory at Farnborough, and was first tested experimentally as early as 1914 on an SE-4 biplane. Interestingly enough, the SPAD used ordinary round wire, and in spite of this was the fastest of all World War I aircraft.
This author was struck by another example of the effect of cylinder drag while traveling in Charleston, South Carolina, shortly after hurricane Hugo devastated the area on September 28, 1989. Traveling north out of Charleston on U. S. Route 17, near the small fishing town of McClellanville, one passes through the Francis Marion National Forest. This forest was virtually destroyed by the hurricane; 60-ft pine trees were snapped off near their base, and approximately 8 out of every 10 trees were down. The sight bore an eerie resemblance to scenes from the battlefields in France during World War I. What type of force can destroy an entire forest in this fashion? To answer this question, we note that the Weather Bureau measured wind gusts as high as 175 mi/h during the hurricane. Let us approximate the wind force on a typical 60-ft pine tree by the aerodynamic drag on a cylinder of a length of 60 ft and a diameter of 5 ft. Since V = 175 mi/h = 256.7 ft/s, Poo = 0.002377 slug/ft3, and
|
(0.002377) (256.7)(5) |
|
= 8.16 x 10[12] |
= 3.7373 x 10⁻⁷ slug/(ft • s), then the Reynolds number is
Examining Figure 3.44, we see that Сд = 0.7. Since Сд is based on the drag per unit length of the cylinder as well as the projected frontal area, we have for the total drag exerted on an entire tree that is 60 ft tall
D = qocSCo = PooVl(d)(60)CD
= і (0.002377)(256.7)2(5)(60)(0.7) = 16,446 lb
a 16,000 lb force on the tree—it is no wonder a whole forest was destroyed. (In the above analysis, we neglected the end effects of the flow over the end of the vertical cylinder. Moreover, we did not correct the standard sea level density for the local reduction in barometric pressure experienced inside a hurricane. However, these are relatively small effects in comparison to the overall force on the cylinder.) The aerodynamics of a tree, and especially that of a forest, are more sophisticated than discussed here. Indeed, the aerodynamics of trees have been studied experimentally with trees actually mounted in a wind tunnel.6


