Applied Aerodynamics: The Flow over an Airfoil—The Real Case
In this chapter, we have studied the inviscid, incompressible flow over airfoils. When compared with actual experimental lift and moment data for airfoils in low-speed flows, we have seen that our theoretical results based on the assumption of inviscid flow are quite good—with one glaring exception. In the real case, flow separation occurs over the top surface of the airfoil when the angle of attack exceeds a certain value—the “stalling” angle of attack. As described in Section 4.3, this is a viscous effect. As shown in Figure 4.4, the lift coefficient reaches a local maximum denoted by c’/.max, and the angle of attack at which q max is achieved is the stalling angle of attack. An increase in a beyond this value usually results in a (sometimes rather precipitous) drop in lift. At angles of attack well below the stalling angle, the experimental data
clearly show a linear increase in q with increasing a—a result that is predicted by the theory presented in this chapter. Indeed, in this linear region, the inviscid flow theory is in excellent agreement with the experiment, as reflected in Figure 4.5 and as demonstrated by Example 4.2. However, the inviscid theory does not predict flow separation, and consequently the prediction of Q, max and the stalling angle of attack must be treated in some fashion by viscous flow theory. Such viscous flow analyses are the purview of Part 4. On the other hand, the purpose of this section is to examine the physical features of the real flow over an airfoil, and flow separation is an inherent part of this real flow. Therefore, let us take a more detailed look at how the flow field over an airfoil changes as the angle of attack is increased, and how the lift coefficient is affected by such changes.
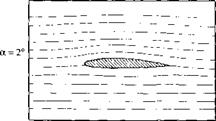
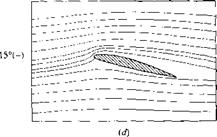
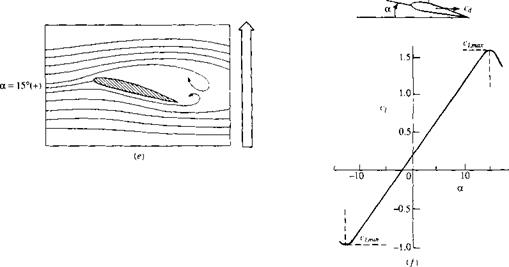
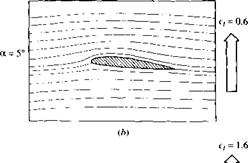
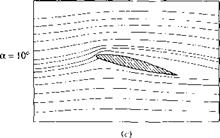
The flow fields over an NACA 4412 airfoil at different angles of attack are shown in Figure 4.34. Here, the streamlines are drawn to scale as obtained from the experimental results of Hikaru Ito given in Reference 50. The experimental streamline patterns were made visible by a smoke wire technique, wherein metallic wires spread with oil over their surfaces were heated by an electric pulse and the resulting white smoke creates visible streaklines in the flow field. In Figure 4.34, the angle of attack is progressively increased as we scan from Figure 4.34a to e; to the right of each streamline picture is an arrow, the length of which is proportional to the value of the lift coefficient at the given angle of attack. The actual experimentally measured lift curve for the airfoil is given in Figure 4.34/. Note that at low angle of attack, such as a — 2° in Figure 4.34a, the streamlines are relatively undisturbed from their freestream shapes and q is small. As a is increased to 5°, as shown in Figure 4.34£>, and then to 10°, as shown in Figure 4.34c, the streamlines exhibit a pronounced upward deflection in the region of the leading edge, and a subsequent downward deflection in the region of the trailing edge. Note that the stagnation point progressively moves downstream of the leading edge over the bottom surface of the airfoil as a is increased. Of course, c; increases as a is increased, and, in this region, the increase is linear, as seen in Figure 4.34/. When a is increased to slightly less than 15°, as shown in Figure 4.34d, the curvature of the streamlines is particularly apparent. In Figure 4.34/ the flow field is still attached over the top surface of the airfoil. However, as a is further increased slightly above 15°, massive flow-field separation occurs over the top surface, as shown in Figure 4.34e. By slightly increasing a from that shown in Figure 434d to that in Figure 4.34e, the flow quite suddenly separates from the leading edge and the lift coefficient experiences a precipitous decrease, as seen in Figure 4.34/.
The type of stalling phenomenon shown in Figure 4.34 is called leading-edge stall; it is characteristic of relatively thin airfoils with thickness ratios between 10 and 16 percent of the chord length. As seen above, flow separation takes place rather suddenly and abruptly over the entire top surface of the airfoil, with the origin of this separation occurring at the leading edge. Note that the lift curve shown in Figure 4.34/ is rather sharp-peaked in the vicinity of Q max with a rapid decrease in q above the stall.
A second category of stall is the trailing-edge stall. This behavior is characteristic of thicker airfoils such as the NACA 4421 shown in Figure 4.35. Here, we see a progressive and gradual movement of separation from the trailing edge toward the
|
|
|
|
|
|
|
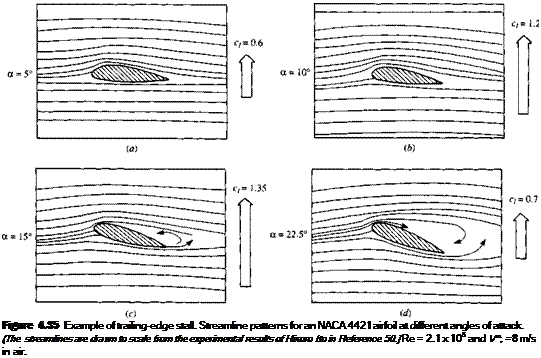
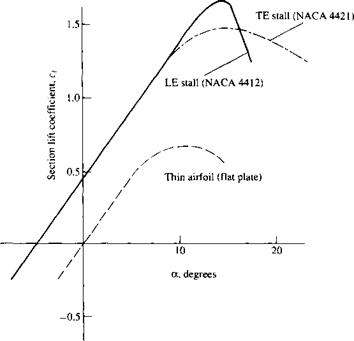
leading edge as a is increased. The lift curve for this case is shown in Figure 4.36. The solid curve in Figure 4.36 is a repeat of the results for the NACA 4412 airfoil shown earlier in Figure 4.34/—an airfoil with a leading-edge stall. The dot-dashed curve is the lift curve for the NACA 4421 airfoil—an airfoil with a trailing-edge stall. In comparing these two curves, note that:
1. The trailing-edge stall yields a gradual bending-over of the lift curve at maximum lift, in contrast to the sharp, precipitous drop in q for the leading-edge stall. The stall is “soft” for the trailing-edge stall.
2. The value of c/.max is not so large for the trailing-edge stall.
3. For both the NACA 4412 and 4421 airfoils, the shape of the mean camber line is the same. From the thin airfoil theory discussed in this chapter, the linear lift slope and the zero-lift angle of attack should be the same for both airfoils; this is confirmed by the experimental data in Figure 4.36. The only difference between the two airfoils is that one is thicker than the other. Hence, comparing results shown in Figures 4.34 to 4.36, we conclude that the major effect of thickness of the airfoil is its effect on the value of ct max, and this effect is mirrored by the leading-edge stall behavior of the thinner airfoil versus the trailing-edge stall behavior of the thicker airfoil.
There is a third type of stall behavior, namely, behavior associated with the extreme thinness of an airfoil. This is sometimes labeled as “thin airfoil stall.” An extreme example of a very thin airfoil is a flat plate; the lift curve for a flat plate is
|
Figure 4.36 Lift-coefficient curves for three airfoils with different aerodynamic behavior: trailing-edge stall (NACA4421 airfoil), leading-edge stall (NACA4412 airfoil), thin airfoil stall (flat plate). |
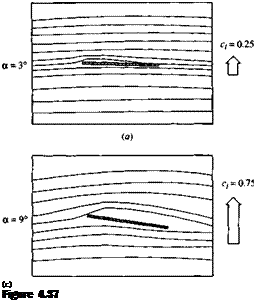
shown as the dashed curve in Figure 4.36 labeled “thin airfoil stall.” The streamline patterns for the flow over a flat plate at various angles of attack are given in Figure 4.37. The thickness of the flat plate is 2 percent of the chord length. Inviscid, incompressible flow theory shows that the velocity becomes infinitely large at a sharp convex comer; the leading edge of a flat plate at an angle of attack is such a case. In the real flow over the plate as shown in Figure 4.37, nature addresses this singular behavior by having the flow separate at the leading edge, even for very low values of a. Examining Figure 4.37a, where a = 3°, we observe a small region of separated flow at the leading edge. This separated flow reattaches to the surface further downstream, forming a separation bubble in the region near the leading edge. As a is increased, the reattachment point moves further downstream; that is, the separation bubble becomes larger. This is illustrated in Figure 4.37/? where a = 7°. At a = 9° (Figure 4.37c), the separation bubble extends over almost the complete flat plate. Referring back to Figure 4.36, we note that this angle of attack corresponds to c/ max for the flat plate. When a is increased further, total flow separation is present, such as shown in Figure 4.37d. The lift curve for the flat plate in Figure 4.36 shows an early departure from its linear variation at about a = 3°; this corresponds to the formation of the leading-edge separation bubble. The lift curve gradually bends over as a is increased further and exhibits a very gradual and “soft” stall. This is a trend similar to the
 |
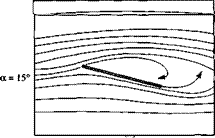 |
Example of thin airfoil stall. Streamline patterns for a flat plate at angle of attack. (The streamlines are drawn to scale from the experimental data of Hikaru Ito in Reference 50.)
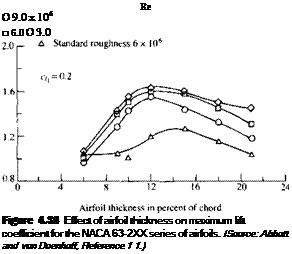
case of the trailing-edge stall, although the physical aspects of the flow are quite different between the two cases. Of particular importance is the fact that Q, max for the flat plate is considerably smaller than that for the two NACA airfoils compared in Figure 4.36. Hence, we can conclude from Figure 4.36 that the value of с/іШах is critically dependent on airfoil thickness. In particular, by comparing the flat plate with the two NACA airfoils, we see that some thickness is vital to obtaining a high value of Q max. However, beyond that, the amount of thickness will influence the type of stall (leading-edge versus trailing-edge), and airfoils that are very thick tend to exhibit reduced values of c; max as the thickness increases. Hence, if we plot Q. max versus thickness ratio, we expect to see a local maximum. Such is indeed the case, as shown in Figure 4.38. Here, experimental data for c/,max for the NACA 63- 2XX series of airfoils is shown as a function of the thickness ratio. Note that as the thickness ratio increases from a small value, c/ max first increases, reaches a maximum value at a thickness ratio of about 12 percent, and then decreases at larger thickness ratios. The experimental data in Figure 4.38 is plotted with the Reynolds number as a parameter. Note that Q max for a given airfoil is clearly a function of Re, with higher values of c;?max corresponding to higher Reynolds numbers. Since flow separation is responsible for the lift coefficient exhibiting a local maximum, since flow separation is a viscous phenomenon, and since a viscous phenomenon is governed by a Reynolds number, it is no surprise that q max exhibits some sensitivity to Re.
When was the significance of airfoil thickness first understood and appreciated? This question is addressed in the historical note in Section 4.13, where we will see
 |
that the aerodynamic properties of thick airfoils even transcended technology during World War I and impacted the politics of the armistice.
Let us examine some other aspects of airfoil aerodynamics—aspects that are not always appreciated in a first study of the subject. The simple generation of lift by an airfoil is not the prime consideration in its design—even a barn door at an angle of attack produces lift. Rather, there are two figures of merit that are primarily used to judge the quality of a given airfoil:
1. The lift-to-drag ratio L/D. An efficient airfoil produces lift with a minimum of drag; that is, the ratio of lift-to-drag is a measure of the aerodynamic efficiency of an airfoil. The standard airfoils discussed in this chapter have high L/D ratios— much higher than that of a barn door. The L/D ratio for a complete flight vehicle has an important impact on its flight performance; for example, the range of the vehicle is directly proportional to the L/D ratio. (See Reference 2 for an extensive discussion of the role of L/D on flight performance of an airplane.)
2. The maximum lift coefficient c;>max. An effective airfoil produces a high value of ci, max—much higher than that produced by a bam door.
The maximum lift coefficient is worth some additional discussion here. For a complete flight vehicle, the maximum lift coefficient CT max determines the stalling speed of the aircraft as discussed in the Design Box at the end of Section 1.8. From Equation (1.47), repeated below:
![]()
|
|
|
|
|
|
|
|
Therefore, a tremendous incentive exists to increase the maximum lift coefficient of an airfoil, in order to obtain either lower stalling speeds or higher payload weights at the same speed, as reflected in Equation (1.47). Moreover, the maneuverability of an airplane (i. e„ the smallest possible turn radius and the fastest possible turn rate) depends on a large value of C7,max (see Section 6.17 of Reference 2). On the other hand, for an airfoil at a given Reynolds number, the value of c; max is a function primarily of its shape. Once the shape is specified, the value of Q, max is what nature dictates, as we have already seen. Therefore, to increase c/>max beyond such a value, we must carry out some special measures. Such special measures include the use of flaps and/or leading-edge slats to increase c/,max above that for the reference airfoil itself. These are called high-lift devices, and are discussed in more detail below.
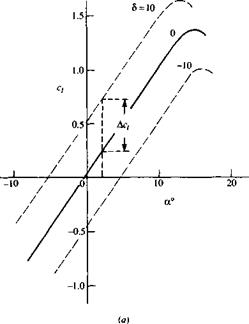
A trailing-edge flap is simply a portion of the trailing-edge section of the airfoil that is hinged and which can be deflected upward or downward, as sketched in the insert in Figure 4.39a. When the flap is deflected downward (a positive angle <5 in Figure 4.39a, the lift coefficient is increased, as shown in Figure 4.39a. This increase is due to an effective increase in the camber of the airfoil as the flap is deflected
|
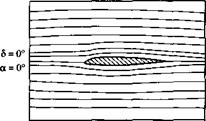
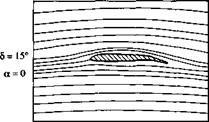
downward. The thin airfoil theory presented in this chapter clearly shows that the zero-lift angle of attack is a function of the amount of camber [see Equation (4.61)], with о!^=о becoming more negative as the camber is increased. In terms of the lift curve shown in Figure 4.39a, the original curve for no flap deflection goes through the origin because the airfoil is symmetric; however, as the flap is deflected downward, this lift curve simply translates to the left because aL=0 is becoming more negative. In Figure 4.39a, the results are given for flap deflections of ±10°. Comparing the case for 5 = 10° with the no-deflection case, we see that, at a given angle of attack, the lift coefficient is increased by an amount Де/ due to flap deflection. Moreover, the actual value of Cf, max is increased by flap deflection, although the angle of attack at which С/ max occurs is slightly decreased. The change in the streamline pattern when the flap is deflected is shown in Figure 4.39b and c. Figure 4.39b is the case for a = 0 and 5 = 0 (i. e., a symmetric flow). However, when a is held fixed at zero, but the flap is deflected by 15°, as shown in Figure 4.39c, the flow field becomes unsymmetrical and resembles the lifting flows shown (e. g., in Figure 4.34). That is, the streamlines in Figure 4.39c are deflected upward in the vicinity of the leading edge and downward near the trailing edge, and the stagnation point moves to the lower surface of the airfoil—just by deflecting the flap downward.
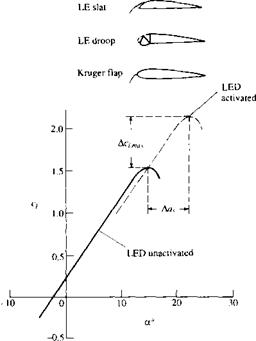
High-lift devices can also be applied to the leading edge of the airfoil, as shown in the insert in Figure 4.40. These can take the form of a leading-edge slat, leading – edge droop, or a leading-edge flap. Let us concentrate on the leading-edge slat,
|
Figure 4.40 Effect of leading-edge flap on lift coefficient. |
 |
 |
 |
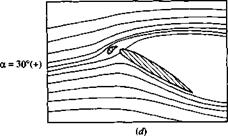 |
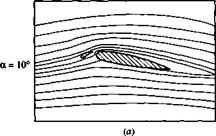
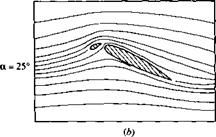
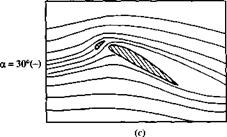
which is simply a thin, curved surface that is deployed in front of the leading edge. In addition to the primary airflow over the airfoil, there is now a secondary flow that takes place through the gap between the slat and the airfoil leading edge. This secondary flow from the bottom to the top surface modifies the pressure distribution over the top surface; the adverse pressure gradient which would normally exist over much of the top surface is mitigated somewhat by this secondary flow, hence delaying flow separation over the top surface. Thus, a leading-edge slat increases the stalling angle of attack, and hence yields a higher c/>max, as shown by the two lift curves in Figure 4.40, one for the case without a leading-edge device and the other for the slat deployed. Note that the function of a leading-edge slat is inherently different from that of a trailing-edge flap. There is no change in aL=o; rather, the lift curve is simply extended to a higher stalling angle of attack, with the attendant increase in cymax. The streamlines of a flow field associated with an extended leading-edge slat are shown in Figure 4.41. The airfoil is in an NACA 4412 section. (Note: The flows shown in Figure 4.41 do not correspond exactly with the lift curves shown in Figure 4.40, although the general behavior is the same.) The stalling angle of attack for the NACA 4412 airfoil without slat extension is about 15°, but increases to about 30° when the slat is extended. In Figure 4.41a, the angle of attack is 10°. Note the flow through the gap between the slat and the leading edge. In Figure 4.4lb, the angle of attack is 25° and the flow is still attached. This prevails to an angle of attack slightly less than 30°, as shown in Figure 4.41c. At slightly higher than 30° flow separation suddenly occurs and the airfoil stalls.
Figure 4.41 Effect of a leading-edge slat on the streamline pattern over an NACA 4412 airfoil.
(The streamlines are drawn to scale from the experimental data in Reference 50.J
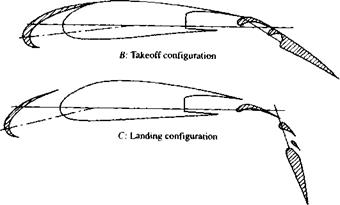
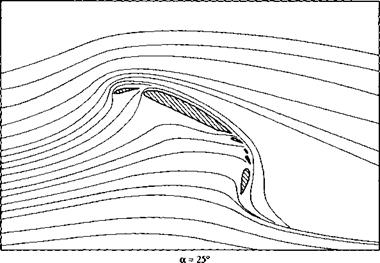
The high-lift devices used on modern, high-performance aircraft are usually a combination of leading-edge slats (or flaps) and multielement trailing-edge flaps. Typical airfoil configurations with these devices are sketched in Figure 4.42. Three configurations including the high-lift devices are shown: A—the cruise configuration, with no deployment of the high-lift devices; В—a typical configuration at takeoff, with both the leading – and trailing-edge devices partially deployed; and C—a typical configuration at landing, with all devices fully extended. Note that for configuration C, there is a gap between the slat and the leading edge and several gaps between the different elements of the multielement trailing-edge flap. The streamline pattern for the flow over such a configuration is shown in Figure 4.43. Flere, the leading-edge slat and the multielement trailing-edge flap are fully extended. The angle of attack is 25°. Although the main flow over the top surface of the airfoil is essentially separated, the local flow through the gaps in the multi-element flap is locally attached to the top surface of the flap; because of this locally attached flow, the lift coefficient is still quite high, on the order of 4.5.
With this, we end our discussion of the real flow over airfoils. In retrospect, we can say that the real flow at high angles of attack is dominated by flow separation—a phenomenon that is not properly modeled by the inviscid theories presented in this chapter. On the other hand, at lower angles of attack, such as those associated with the cruise conditions of an airplane, the inviscid theories presented here do an excellent job of predicting both lift and moments on an airfoil. Moreover, in this section, we have clearly seen the importance of airfoil thickness in determining the angle of
|
A: Cruise configuration |
|
Figure 4.42 Airfoil with leading-edge and trailing-edge high-lift mechanisms. The trailing-edge device is a multi-element flap. |
|
Figure 4.43 Effect of leading-edge and multi-element flaps on the streamline pattern around an airfoil at angle of attack of 25°. (The streamlines are drawn to scale from the experimental data of Reference 50.) |
attack at which flow separation will occur, and hence greatly affecting the maximum lift coefficient.


