. Cryogenic Wind Tunnels
PSP measurements were made in cryogenic wind tunnels where the oxygen concentration in the working nitrogen gas is extremely low and temperature is as low as 90 K (Asai et al. 1997a; Upchurch et al. 1998). The development of cryogenic PSP formulations was motivated by the needs of global pressure measurement techniques in large-scale pressurized cryogenic wind tunnels such as the National Transonic Facility (NTF) at NASA Langley and the European Transonic Wind Tunnel (ETW). Asai et al (1997a) developed a binder-free PSP coating on an anodized aluminum surface and measured the surface pressure distributions on a 14% thick circular-arc bump model in a small cryogenic wind tunnel in the National Aerospace Laboratory (NAL) in Japan. PSP data wee in good agreement with pressure tap data at 100 K over a range of the Mach numbers of 0.75-0.84. However, the methodology of coating on an anodized surface cannot be applied to stainless steel models typically used in cryogenic wind tunnels. Upchurch et al. (1998) developed a polymer-based cryogenic PSP that could be universally applicable to all types of surfaces including stainless steel and this paint was successfully demonstrated in pressure measurements on an airfoil in the 0.3-m cryogenic tunnel at NASA Langley. Asai et al. (2000, 2002) also presented a polymer-based cryogenic PSP formulation applied to cryogenic wind tunnels and short-duration shock tunnels, which was based on a polymer named Poly(TMSP) having extremely high gas permeability. This PSP can be dissolved
into a solvent and applied using an airbrush to any model surface including stainless steel in contrast to AA-PSP only applicable to aluminum or aluminum alloy. Hitherto, cryogenic PSP measurements have not been conducted in NTF and ETW due to safety concerns on injection of a small amount of air (oxygen) into the tunnels. Therefore, small cryogenic tunnels are more suitable to preliminary pioneering experiments since they are more adaptable and relatively inexpensive to run.
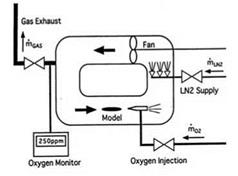
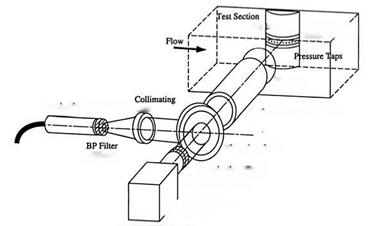
Asai et al. (2000, 2002) described application of Poly(TMSP)-based PSP and AA – PSP data to a circular-arc bump model and a delta wing model in the 0.1-m Transonic Cryogenic Wind Tunnel at NAL. Figure 9.41 is a schematic of the tunnel operated by controlling both liquid nitrogen injection and gaseous nitrogen exhaust. A small amount of air was injected just downstream of the test section, and the oxygen concentration in flow was measured from sampled exhaust gas using a Zirconia (ZrO2) sensor. The oxygen concentration was varied from near zero to 2000 ppm by adjusting the flow rate of the injected air. Figure 9.42 is a schematic of the optical setup for experiments. The model mounted on the sidewall was viewed through a 70mm diameter window on the opposite sidewall.
A 300-watt xenon lamp with a band-pass filter (400±50nm) was used for illumination. A dichroic mirror (550 nm) was used to separate the luminescent emission of PSP from the excitation light. A 14-bit cooled CCD digital camera with a band-pass filter (650±20 nm) placed before the lens was used for luminescence measurements. As shown in Fig. 9.43, a 2D bump model and a clipped delta wing were used for experiments. The cross-section of the aluminum bump model was a 14% circular arc having the chord length of 50 mm. The bump model was equipped with 16 pressure taps at the mid-span. The Poly(TMSP)-PSP were coated in two 8mm wide strips on the surface using an airbrush, while other two strips were anodized to make AA-PSP using a method developed by Sakaue et al. (1999). The stainless steel delta wing model had a 65o-sweep angle and a sharp leading edge, on which an array of eight taps was installed at 80% of the 60-mm model chord. The model was strut-mounted on the sidewall at the angle of attack of 20o. The Poly(TMSP)-PSP was applied to the whole upper surface of the delta wing using an airbrush.
|
Fig. 9.41. Schematic of the NAL 0.1 m Transonic Cryogenic Wind Tunnel. From Asai et al. (2002) |
![]()
 Dichroic Mirror
IR Rejection Filter
LP Filter (620nm)
/ Digiu / (12bits)
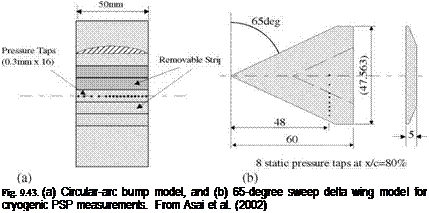 |
Fig. 9.42. Schematic of an optical setup for PSP measurements in the NAL 0.1 m Transonic Cryogenic Wind Tunnel. From Asai et al. (2002)
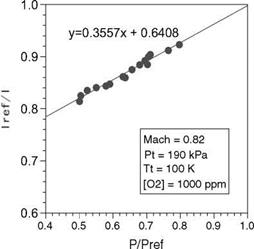
In experiments, the Mach number was set at either 0.4 or 0.82, and the total temperature and pressure in the tunnel were maintained at 100 K and 190 kPa, respectively. The oxygen concentration was varied up to 1000 ppm. Figure 9.44 shows in-situ calibration results for Poly(TMSP)-PSP at the total temperature Tt = 100 K and [O2] = 1000 ppm, indicating the linear Stern-Volmer relation between the luminescent intensity ratio Ire/I and the relative pressure p/pref Since the model surface was fairly isothermal in cryogenic flows, a single calibration curve was used for data reduction on the entire surface of the model. Figure 9.45 shows the
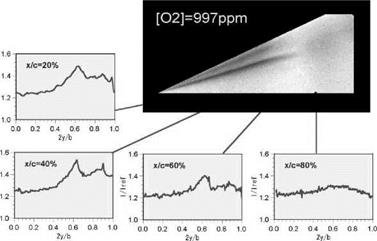
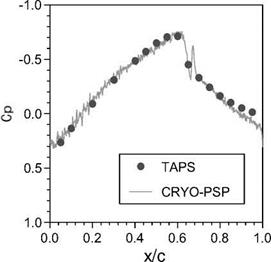
pressure distribution obtained using in-situ calibration on the bump model at Mach 0.82 and T = 100 K, where the image at Mach 0.4 was used as a reference image since the tunnel could not run below that speed. The PSP-derived pressure data were in good agreement with the pressure tap data after in-situ calibration is applied. It was found that the use of a priori calibration did not produce results consistent with the pressure tap data because the slope of a priori calibration curve was twice as large as that of the in-situ calibration curve. For the delta wing model, the raw images were taken at Mach 0.4 and 0.75, the total temperature T t = 100 K, and the oxygen mole fraction [O2] = 997 ppm. Figure 9.46 presents a ratio of the wind-on image at Mach 0.75 to the reference image at Mach 0.4, visualizing the leading edge vortices. The primary and secondary separations were clearly observed. Figure 9.46 also shows the spanwise distributions of the intensity ratio I/Iref on the wing at four chordwise locations. The intensity ratio profiles were noisy because the intensity difference between the images at Mach 0.4 and 0.75 was relatively small. The PSP measurements on the delta wing were basically qualitative.
|
Fig. 9.44. In-situ calibration for Poly(TMSP) PSP at the total temperature Tt = 100 K and [O2] = 1000 ppm. From Asai et al. (2002) |
![]()
|
|
|
