Expansion and Compression Corners
Nakakita et al. (2000) used anodized aluminum (AA) PSP to measure the pressure fields on the expansion corner and compression corner models at Mach 10 in the NAL Middle Scale Shock Tunnel with a duration of 30 ms. More recent measurements in shock tunnels were made using AA-PSP on a wing-body model, a hemisphere and scramjet inlet models (Nakakita and Asai 2002;
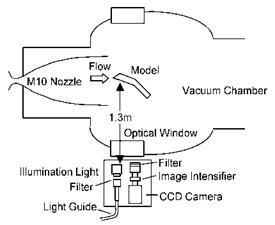
Sakaue et al. 2002b). AA-PSP with a probe molecule Ru(dpp) was used since it had a very short response time of about 30-100 |J. s. Furthermore, because AA – PSP on aluminum models was binder-free and pure aluminum models had high thermal conductivity, an increase of the surface temperature was relatively small (less than 2oC) in most parts of the model during a run in the shock tunnel. The NAL Middle Scale Shock Tunnel had the total temperature of 1180 K, total pressure of 3.4 MPa, Pitot pressure of 7800 Pa, Mach number of 10.4, and Reynolds number 1.6×10⁵ based on the 0.1-m model span. Figure 9.35 shows an optical system for illumination and measurements, which was set at the front of an optical window of a vacuum tank and 1.3 m away from the model. A highly stable continuous xenon lamp (fluctuation of the light intensity was much smaller than 1%) was used as an illumination light source and the illumination light was transmitted through a light guide and projected onto the model by a lens at the exit of the light guide. A cooled 14-bit CCD camera (Hamamatsu C4880-07) attached with an image intensifier (Hamamatsu C6245MOD) was used to detect the luminescent emission from PSP. The intensifier enhanced the capability of the camera to measure weak luminescence in a short exposure time at the cost of introducing additional noise. The spatial resolution of the CCD camera was originally 1008×1018 pixels. However, after 2×2 binning was applied to reduce the shot noise and readout noise, the spatial resolution was reduced to 504×509 pixels. To separate the illumination light from the luminescent emission, a band-pass filter (460±50nm) was placed between the exit of the light guide and the condenser lens transmits; another band-pass filter (600-800nm) was mounted in the front of the intensifier to eliminate the illumination light projected to the CCD camera. The exposure time for the camera was 20 ms.
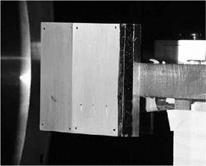
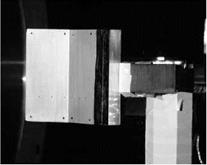
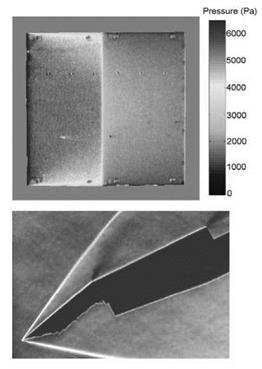
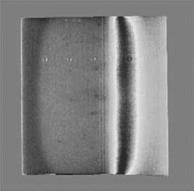
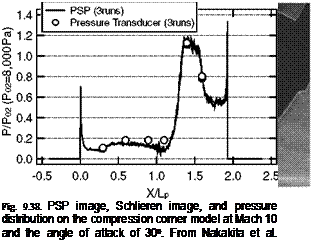
Figure 9.36 shows the expansion corner and compression corner models made of pure aluminum. Both models had an upstream plane connected to a downstream plane. The expansion corner model had the downstream plane deflecting outward 15o relative to the upstream one, whereas the compression corner model had the downstream plane having a 30o ramp against the upstream one. There were six pressure taps connected Kulite (XCS-093-5A) pressure transducers on each model to provide reference pressure data for comparison. The expansion corner model was tested at the angles of attack of 10, 20, 30 and 40 degrees. Figure 9.37 shows a typical PSP image and a Schlieren image along with a comparison plot of PSP data with pressure tap data at the angle of attack of 40o. In Fig. 9.37, the horizontal axis is the coordinate along the model surface normalized by the length of upstream plane Lp and the vertical axis is the local pressure normalized by the Pitot pressure P02. PSP data were in good agreement with the pressure tap data. On the expansion corner model, the flow field on each plane can be considered as a 2D wedge-flow where pressure on the surface is constant. As shown in Fig. 9.37, the pressure distributions are nearly uniform on the upstream and downstream planes. The Schlieren images indicate a shock wave at the leading edge and an expansion fan at the corner of the model. The compression corner model was also tested at the angles of attack of 0, 10, 20, and 30 degrees. Figure 9.38 shows a typical PSP image, a Schlieren image, and a pressure distribution plot for the compression corner at the angle of attack of
30o. The Schlieren image indicates a much more complicated flow field
including shock/boundary-layer interaction and shock/shock interaction on the compression corner model. The high-pressure region was associated with shock/shock interaction near the corner. Again, PSP data were in good agreement with the pressure tap data.
|
Fig. 9.35. Optical system for PSP measurements and calibration in the NAL Middle Scale Shock Tunnel (viewing from the ceiling). From Nakakita et al. (2000) |
 |
 |
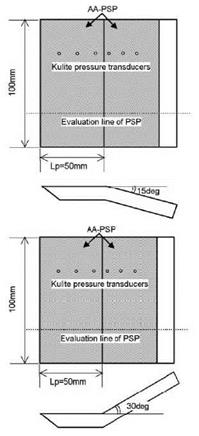 |
Fig. 9.36. Experimental models: (a) Expansion corner model and (b) Compression corner model. From Nakakita et al. (2000)
![]()
 |
0.8
‘ns
Q_
0.6
о
о
со
0.4
Q_
0.2 0.0
-0.5 0.0 0.5 1.0 1.5 2.0 2.5
X/Lp
Fig. 9.37. PSP image, Schlieren photograph, and pressure distribution on the expansion corner model at Mach 10 and the angle of attack of 40o. From Nakakita et al. (2000)
Pressure (Pa) _18000
 И16000
Ц-мооо 12000 10000 8000 6000 14000
B2OOO
-Bo


