Flow Similarity
Consider two different flow fields over two different bodies. By definition, different flows are dynamically similar if:
1. The streamline patterns are geometrically similar.
2. The distributions of V/ Voo, p/p^, T/Tetc., throughout the flow field are the same when plotted against common nondimensional coordinates.
3. The force coefficients are the same.
Actually, item 3 is a consequence of item 2; if the nondimensional pressure and shear stress distributions over different bodies are the same, then the nondimensional force coefficients will be the same.
The definition of dynamic similarity was given above. Question: What are the criteria to ensure that two flows are dynamically similar? The answer comes from the results of the dimensional analysis in Section 1.7. Two flows will be dynamically similar if:
1. The bodies and any other solid boundaries are geometrically similar for both flows.
2. The similarity parameters are the same for both flows.
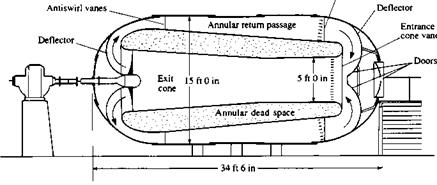
So far, we have emphasized two parameters, Re and Mx. For many aerodynamic applications, these are by far the dominant similarity parameters. Therefore, in a limited sense, but applicable to many problems, we can say that flows over geometrically similar bodies at the same Mach and Reynolds numbers are dynamically similar, and hence the lift, drag, and moment coefficients will be identical for the bodies. This is a key point in the validity of wind-tunnel testing. If a scale model of a flight vehicle is tested in a wind tunnel, the measured lift, drag, and moment coefficients will be the same as for free flight as long as the Mach and Reynolds numbers of the wind-tunnel test-section flow are the same as for the free-flight case. As we will see in subsequent chapters, this statement is not quite precise because there are other similarity parameters that influence the flow. In addition, differences in freestream turbulence between the wind tunnel and free flight can have an important effect on Co and the maximum value of CL. However, direct simulation of the free-flight Re and Мж is the primary goal of many wind-tunnel tests.
Example 1.4
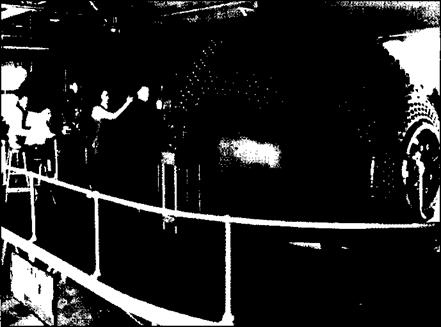
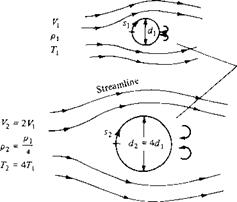
Consider the flow over two circular cylinders, one having four times the diameter of the other, as shown in Figure 1.20. The flow over the smaller cylinder has a freestream density, velocity and temperature given by p, V, and Гь respectively. The flow over the larger cylinder has a freestream density, velocity, and temperature given by p2, V2, and T2, respectively, where p2 = pi/4, V2 = 2Vi, and T2 = AT. Assume that both ц and a are proportional to T1’2. Show that the two flows are dynamically similar.
|
|
|
![]()
|
|
|
|
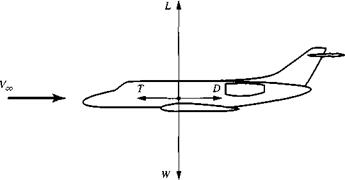
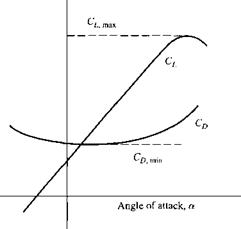
Note that for most conventional flight situations, the magnitude of L and W is much larger than the magnitude of T and D, as indicated by the sketch in Figure 1.23. Typically, for conventional cruising flight, L/D ~ 15 to 20. For an airplane of given shape, such as that sketched in Figure 1.24, at given Mach and Reynolds number, Cl and CD are simply functions of the angle of attack, a of the airplane. This is the message conveyed by Equations (1.42) and (1.43). It is a simple and basic message—part of the beauty of nature—that the actual values of CL and Cd for a given body shape just depend on the orientation of the body in the flow, i. e., angle of attack. Generic variations for CL and Cd versus a are sketched in Figure 1.25. Note that CL increases linearly with a until an angle of attack is reached when the wing stalls, the lift coefficient reaches a peak value, and then drops off as a is further increased. The maximum value of the lift coefficient is denoted by Ci milx, as noted in Figure 1.25. The lowest possible velocity at which the airplane can maintain steady, level flight is the stalling velocity, Vstaii; it is dictated by the value of Cl, max, as follows.6 From the definition of lift coefficient given in Section 1.5, applied for the case of level flight where L = W, we have |
|
|
|
|
|
|
|
|
|
|
|
|
|
![]()
|
|
|
|
|
|
|
|
|
|
|
|
|
|
|
|
|
|
|
For a given airplane, without the aid of any artificial devices, Cz,,max is determined purely by nature, through the physical laws for the aerodynamic flowfield over the airplane. However, the airplane designer has some devices available that artificially increase CL, mm beyond that for the basic airplane shape. These mechanical devices are called high-lift devices-, examples are flaps, slats, and slots on the wing which, when deployed by the pilot, serve to increase CLлшх, and hence decrease the stalling speed. High-lift devices are usually deployed for landing and take-off; they are discussed in more detail in Section 4.11.
On the other extreme of flight velocity, the maximum velocity for a given airplane with a given maximum thrust from the engine is determined by the value of minimum drag coefficient, CD min, where Со, тіп is marked in Figure 1.25. From the definition of drag coefficient in Section 1.5, applied for the case of steady, level flight where T = D, we have
![]()
![]() D _ T _ IT
D _ T _ IT
Чос s qxs PocV^S
Solving Equation (1.48) for 14c,
2 T
Рос SC о
For a given airplane flying at maximum thrust Гтах and a given altitude, from Equation (1.49) the maximum value of Vx corresponds to flight at CD, min
From the above discussion, it is clear that the aerodynamic coefficients are important engineering quantities that dictate the performance and design of airplanes. For example, stalling velocity is determined in part by Ci max, and maximum velocity is determined in part by C0 min.
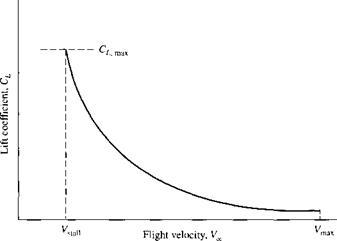
Broadening our discussion to the whole range of flight velocity for a given airplane, note from Equation (1.45) that each value of Vx corresponds to a specific value of CL. Therefore, over the whole range of flight velocity from Tstaii to Fmax, the airplane lift coefficient varies as shown genetically in Figure 1.26. The values of CL given by the curve in Figure 1.26 are what are needed to maintain level flight over the whole range of velocity at a given altitude. The airplane designer must design the airplane to achieve these values of CL for an airplane of given weight and wing area. Note that the required values of Cl decrease as Vx increases. Examining the lift coefficient variation with angle of attack shown in Figure 1.26, note that as the airplane flies faster, the angle of attack must be smaller, as also shown in Figure 1.26. Hence, at high speeds, airplanes are at low a, and at low speeds, airplanes are at high a; the specific angle of attack which the airplane must have at a specific Vx is dictated by the specific value of CL required at that velocity.
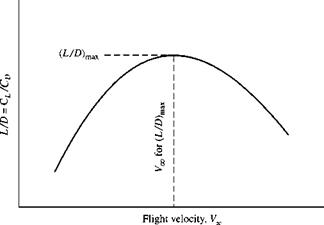
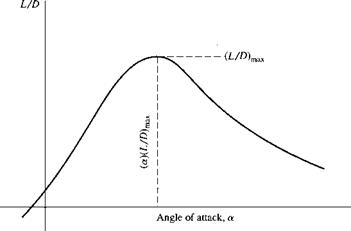
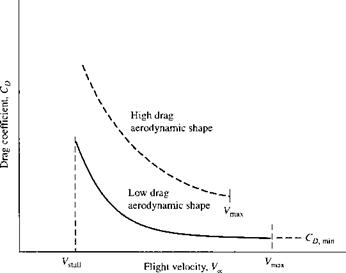
Obtaining raw lift on a body is relatively easy—even a barn door creates lift at angle of attack. The name of the game is to obtain the necessary lift with as low a drag as possible. That is, the values of CL required over the entire flight range for an airplane, as represented by Figure 1.26, can sometimes be obtained even for the least effective lifting shape—just make the angle of attack high enough. But CD also varies with as governed by Equation (1.48); the generic variation of Co with is sketched in Figure 1.27. A poor aerodynamic shape, even though it generates the necessary values of CL shown in Figure 1.26, will have inordinately high values of CD,
![]()
|
|
|
|
|
|
|
|
|
|
|
|
|
![]()
![]()
![]()
|
|
|
|
|

![]()

![]()
|
|
|
|
|
|
|
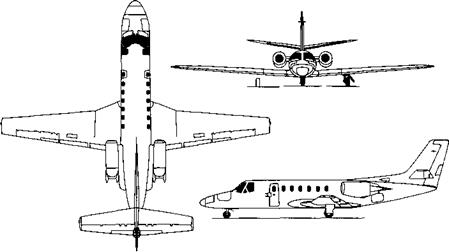
Consider an executive jet transport patterned after the Cessna 560 Citation V shown in three – view in Figure 1.30. The airplane is cruising at a velocity of 492 mph at an altitude of 33,000 ft, where the ambient air density is 7.9656 x 10~4 slug/ft3. The weight and wing planform areas of the airplane are 15,000 lb and 342.6 ft2, respectively. The drag coefficient at cruise is 0.015. Calculate the lift coefficient and the lift-to-drag ratio at cruise.
![]() Solution
Solution
The units of miles per hour for velocity are not consistent units. In the English engineering system of units, feet per second are consistent units for velocity (see Section 2.4 of Reference 2). To convert between mph and ft/s, it is useful to remember that 88 ft/s = 60 mph. For the present example,
Vx> = 492(H) = 721.6 ft/s
From Equation (1.45),
From Equation (1.51),
![]() L _ CL _ 0.21 Ъ ~ ~C~D ~~ 0.015
L _ CL _ 0.21 Ъ ~ ~C~D ~~ 0.015
Remarks: For a conventional airplane such as shown in Figure 1.30, almost all the lift at cruising conditions is produced by the wing; the lift of the fuselage and tail are very small by comparison. Hence, the wing can be viewed as an aerodynamic “lever.” In this example, the lift-to-drag ratio is 14, which means that for the expenditure of one pound of thrust to overcome one pound of drag, the wing is lifting 14 pounds of weight—quite a nice leverage.

|


