Incompressible Flow in a Duct: the Venturi and Low-Speed Wind Tunnel
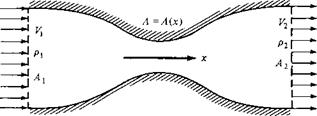
Consider the flow through a duct, such as that sketched in Figure 3.5. In general, the duct will be a three-dimensional shape, such as a tube with elliptical or rectangular cross sections which vary in area from one location to another. The flow through such a duct is three-dimensional and, strictly speaking, should be analyzed by means of the full three-dimensional conservation equations derived in Chapter 2. However, in many applications, the variation of area A = A(x) is moderate, and for such cases it is reasonable to assume that the flow-field properties are uniform across any cross section, and hence vary only in the x direction. In Figure 3.5, uniform flow is sketched at station 1, and another but different uniform flow is shown at station 2. Such flow, where the area changes as a function of x and all the flow-field variables are assumed to be functions of x only, that is, A = A(x), V — V(x), p = p(x), etc., is called quasi-one-dimensional flow. Although such flow is only an approximation of the truly three-dimensional flow in ducts, the results are sufficiently accurate for many aerodynamic applications. Such quasi-one-dimensional flow calculations are frequently used in engineering. They are the subject of this section.
® ©
|
Figure 3.5 Quasi-one-dimensional flow in a duct. |
Consider the integral form of the continuity equation written below:
|
||
|
||
|
||
|
||
![]()
![]()
For steady flow, this becomes
Apply Equation (3.16) to the duct shown in Figure 3.5, where the control volume is bounded by At on the left, A2 on the right, and the upper and lower walls of the duct. Hence, Equation (3.16) is
Along the walls, the flow velocity is tangent to the wall. Since by definition dS is perpendicular to the wall, then along the wall, V • dS = 0, and the integral over the wall surface is zero; that is, in Equation (3.17),
JJ pY • dS = 0 [3.18]
wall
At station 1, the flow is uniform across A. Noting that dS and V are in opposite directions at station 1 (dS always points out of the control volume by definition), we have in Equation (3.17)
//"v-dS = —pA V] [3.19]
-A
At station 2, the flow is uniform across A2, and since dS and V are in the same direction, we have, in Equation (3.17),
JJ pY • dS = p2A2V2 [3.20]
Лі
Substituting Equations (3.18) to (3.20) into (3.17), we obtain
—pAV — p2A2V2 0 — 0
Equation (3.21) is the quasi-one-dimensional continuity equation; it applies to both compressible and incompressible flow.[6] In physical terms, it states that the mass flow
through the duct is constant (i. e., what goes in must come out). Compare Equation (3.21) with Equation (2.43) for mass flow.
Consider incompressible flow only, where p = constant. In Equation (3.21), Pi = p2, and we have
![]() [3.22]
[3.22]
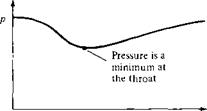
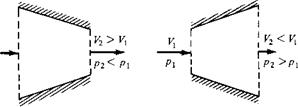
Equation (3.22) is the quasi-one-dimensional continuity equation for incompressible flow. In physical terms, it states that the volume flow (cubic feet per second or cubic meters per second) through the duct is constant. From Equation (3.22), we see that if the area decreases along the flow (convergent duct), the velocity increases; conversely, if the area increases (divergent duct), the velocity decreases. These variations are shown in Figure 3.6; they are fundamental consequences of the incompressible continuity equation, and you should fully understand them. Moreover, from Bernoulli’s equation, Equation (3.15), we see that when the velocity increases in a convergent duct, the pressure decreases; conversely, when the velocity decreases in a divergent duct, the pressure increases. These pressure variations are also shown in Figure 3.6.
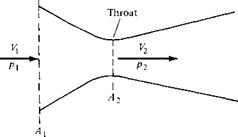
Consider the incompressible flow through a convergent-divergent duct, shown in Figure 3.7. The flow enters the duct with velocity V) and pressure p. The velocity increases in the convergent portion of the duct, reaching a maximum value V2 at the minimum area of the duct. This minimum area is called the throat. Also, in the convergent section, the pressure decreases, as sketched in Figure 3.7. At the throat, the pressure reaches a minimum value p2- In the divergent section downstream of the throat, the velocity decreases and the pressure increases. The duct shown in Figure 3.7 is called a venturi-, it is a device that finds many applications in engineering, and its use dates back more than a century. Its primary characteristic is that the pressure P2 is lower at the throat than the ambient pressure p outside the venturi. This pressure difference p — p2 is used to advantage in several applications. For example, in the carburetor of an automobile engine, there is a venturi through which the incoming air is mixed with fuel. The fuel line opens into the venturi at the throat. Because P2 is less than the surrounding ambient pressure p, the pressure difference p — P2 helps to force the fuel into the airstream and mix it with the air downstream of the throat.
In an application closer to aerodynamics, a venturi can be used to measure airspeeds . Consider a venturi with a given inlet-to-throat area ratio A/A2, as shown in Figure 3.7. Assume that the venturi is inserted into an airstream that has an unknown
![]()
![]()
![]()
![]()
 V,
V,
|
velocity V. We wish to use the venturi to measure this velocity. With regard to the venturi itself, the most direct quantity that can be measured is the pressure difference p і — P2- This can be accomplished by placing a small hole (a pressure tap) in the wall of the venturi at both the inlet and the throat and connecting the pressure leads (tubes) from these holes across a differential pressure gage, or to both sides of a U-tube manometer (see Section 1.9). In such a fashion, the pressure difference Pi — P2 can be obtained directly. This measured pressure difference can be related to the unknown velocity V) as follows. From Bernoulli’s equation, Equation (3.13), we have
![]() Vf = ~(P2 – Pi) + V22 p
Vf = ~(P2 – Pi) + V22 p
From the continuity equations, Equation (3.22), we have
[3.24]
Substituting Equation (3.24) into (3.23), we obtain
![]() v’=h-p’)+(j-Sv‘
v’=h-p’)+(j-Sv‘
Solving Equation (3.25) for Vj, we obtain
|
|
|
|
Equation (3.26) is the desired result; it gives the inlet air velocity V in terms of the measured pressure difference p— pi and the known density p and area ratio A i / A 2. In this fashion, a venturi can be used to measure airspeeds. Indeed, historically the first practical airspeed indicator on an airplane was a venturi used by the French Captain A. Eteve in January 1911, more than 7 years after the Wright brothers’ first powered flight. Today, the most common airspeed-measuring instrument is the Pitot tube (to be discussed in Section 3.4); however, the venturi is still found on some general aviation airplanes, including home-built and simple experimental aircraft.
Another application of incompressible flow in a duct is the low-speed wind tunnel. The desire to build ground-based experimental facilities designed to produce flows of air in the laboratory which simulate actual flight in the atmosphere dates back to 1871, when Francis Wenham in England built and used the first wind tunnel in history.4 From that date to the mid-1930s, almost all wind tunnels were designed to produce airflows with velocities from 0 to 250 mi/h. Such low-speed wind tunnels are still much in use today, along with a complement of transonic, supersonic, and hypersonic tunnels. The principles developed in this section allow us to examine the basic aspects of low-speed wind tunnels, as follows.
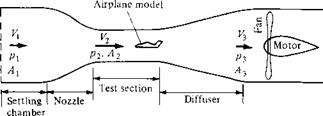
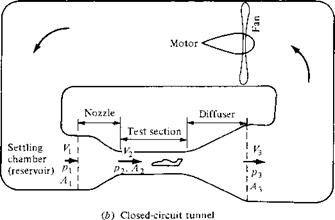
In essence, a low-speed wind tunnel is a large venturi where the airflow is driven by a fan connected to some type of motor drive. The wind-tunnel fan blades are similar to airplane propellers and are designed to draw the airflow through the tunnel circuit. The wind tunnel may be open circuit, where the air is drawn in the front directly from the atmosphere and exhausted out the back, again directly to the atmosphere, as shown in Figure 3.8a; or the wind tunnel may be closed circuit, where the air from the exhaust is returned directly to the front of the tunnel via a closed duct forming a loop, as shown in Figure 3.8b. In either case, the airflow with pressure p enters the nozzle at a low velocity Vi, where the area is Ai. The nozzle converges to a smaller area A2 at the test section, where the velocity has increased to 33 and the pressure has decreased to p2- After flowing over an aerodynamic model (which may be a model of a complete airplane or part of an airplane such as a wing, tail, engine, or nacelle), the air passes into a diverging duct called a diffuser, where the area increases to A3, the velocity decreases to V3, and the pressure increases to рз. From the continuity equation (3.22), the test-section air velocity is
![]() [3.27]
[3.27]
In turn, the velocity at the exit of the diffuser is
![]() [3.28]
[3.28]
The pressure at various locations in the wind tunnel is related to the velocity by Bernoulli’s equation:
![]() P + pVf = P2 + pV% = Рз + рУз
P + pVf = P2 + pV% = Рз + рУз
I 4 For a discussion on the history of wind tunnels, see chapter 4 of Reference 2.
|
|
|
The basic factor that controls the air velocity in the test section of a given low – speed wind tunnel is the pressure difference p — /ъ. To see this more clearly, rewrite Equation (3.29) as
Vi = — (Pi – Pi) + v,2 [3.30]
p
From Equation (3.27), V) = (Аг/АОУг – Substituting into the right-hand side of Equation (3.30), we have
Solving Equation (3.31) for we obtain
|
|||
|
|
||
The area ratio A2/A1 is a fixed quantity for a wind tunnel of given design. Moreover, the density is a known constant for incompressible flow. Therefore, Equation (3.32) demonstrates conclusively that the test-section velocity Vi is governed by the pressure difference p — pi. The fan driving the wind-tunnel flow creates this pressure difference by doing work on the air. When the wind-tunnel operator turns the “control knob” of the wind tunnel and adjusts the power to the fan, he or she is essentially adjusting the pressure difference p — P2 and, in turn, adjusting the velocity via Equation (3.32).
In low-speed wind tunnels, a method of measuring the pressure difference p — pi, hence of measuring Vi via Equation (3.32), is by means of a manometer as discussed in Section 1.9. In Equation (1.56), the density is the density of the liquid in the manometer (not the density of the air in the tunnel). The product of density and the acceleration of gravity g in Equation (1.56) is the weight per unit volume of the manometer fluid. Denote this weight per unit volume by w. Referring to Equation
(1.56) , if the side of the manometer associated with pa is connected to a pressure tap in the settling chamber of the wind tunnel, where the pressure is p, and if the other side of the manometer (associated with рь) is connected to a pressure tap in the test section, where the pressure is P2, then, from Equation (1.56),
p^—pi — wAh
where Ah is the difference in heights of the liquid between the two sides of the manometer. In turn, Equation (3.32) can be expressed as
|
|
In many low-speed wind tunnels, the test section is vented to the surrounding atmosphere by means of slots in the wall; in others, the test section is not a duct at all, but rather, an open area between the nozzle exit and the diffuser inlet. In both cases, the pressure in the surrounding atmosphere is impressed on the test-section flow; hence, pi = 1 atm. (In subsonic flow, a jet that is dumped freely into the surrounding air takes on the same pressure as the surroundings; in contrast, a supersonic free jet may have completely different pressures than the surrounding atmosphere, as we see in Chapter 10.)
Keep in mind that the basic equations used in this section have certain limitations—we are assuming a quasi-one-dimensional inviscid flow. Such equations can sometimes lead to misleading results when the neglected phenomena are in reality important. For example, if A3 = A1 (inlet area of the tunnel is equal to the exit area), then Equations (3.27) and (3.28) yield V3 = V. In turn, from Equation (3.29), ръ = /з,; that is, there is no pressure difference across the entire tunnel circuit. If this were true, the tunnel would run without the application of any power—we would have a perpetual motion machine. In reality, there are losses in the airflow due to friction at the tunnel walls and drag on the aerodynamic model in the test section. Bernoulli’s equation, Equation (3.29), does not take such losses into account. (Review the derivation of Bernoulli’s equation in Section 3.2; note that viscous effects are neglected.) Thus, in an actual wind tunnel, there is a pressure loss due to viscous and drag effects, and p3 < p. The function of the wind-tunnel motor and fan is to
 |
|
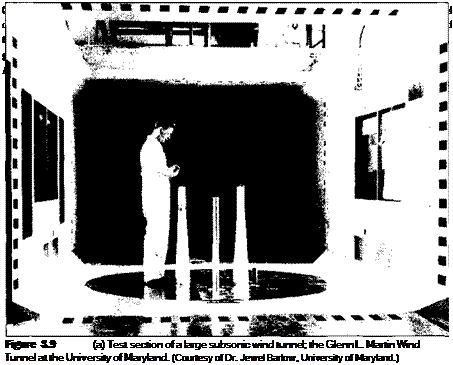
add power to the airflow in order to increase the pressure of the flow coming out of the diffuser so that it can be exhausted into the atmosphere (Figure 3.8a) or returned to the inlet of the nozzle at the higher pressure p (Figure 3.8/;). Photographs of a typical subsonic wind tunnel are shown in Figure 3.9a and b.
(a)
![]()
 |
Consider a low-speed subsonic wind tunnel with a 12/1 contraction ratio for the nozzle. If the flow in the test section is at standard sea level conditions with a velocity of 50 m/s, calculate the height difference in a U-tube mercury manometer with one side connected to the nozzle inlet and the other to the test section.
![]() Solution
Solution
At standard sea level, p = 1.23 kg/m3. From Equation (3.32),
|
P~ P2 = ^Pv2 |
|
1527 N/nr |
However, p, — p2 = wAh. The density of liquid mercury is 1.36 x 10⁴ kg/m Hence,
w = (1.36 x 10⁴ kg/m3)(9.8 m/s2) = 1.33 x!05 N/nr
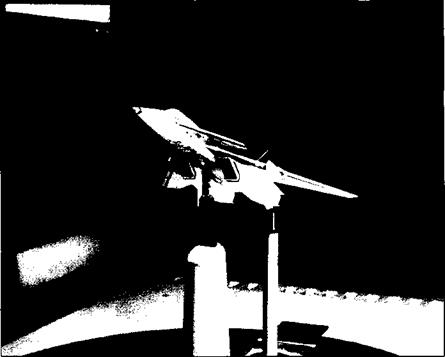
![]() Consider a model of an airplane mounted in a subsonic wind tunnel, such as shown in Figure 3.10. The wind-tunnel nozzle has a 12-to-l contraction ratio. The maximum lift coefficient of
Consider a model of an airplane mounted in a subsonic wind tunnel, such as shown in Figure 3.10. The wind-tunnel nozzle has a 12-to-l contraction ratio. The maximum lift coefficient of
![]()
|
the airplane model is 1.3. The wing planform area of the model is 6 ft2. The lift is measured with a mechanical balance that is rated at a maximum force of 1000 lb; that is, if the lift of the airplane model exceeds 1000 lb, the balance will be damaged. During a given test of this airplane model, the plan is to rotate the model through its whole range of angle of attack, including up to that for maximum CL. Calculate the maximum pressure difference allowable between the wind-tunnel settling chamber and the test section, assuming standard sea level density in the test section (i. e., px = 0.002377 slug/ft3).
|
117.5 lb/ft2 |


