Modern Low-Speed Airfoils
The nomenclature and aerodynamic characteristics of standard NACA airfoils are discussed in Sections 4.2 and 4.3; before progressing further, you should review these sections in order to reinforce your knowledge of airfoil behavior, especially in light of our discussions on airfoil theory. Indeed, the purpose of this section is to provide a modem sequel to the airfoils discussed in Sections 4.2 and 4.3.
During the 1970s, NASA designed a series of low-speed airfoils that have performance superior to the earlier NACA airfoils. The standard NACA airfoils were based almost exclusively on experimental data obtained during the 1930s and 1940s. In contrast, the new NASA airfoils were designed on a computer using a numerical technique similar to the source and vortex panel methods discussed earlier, along with numerical predictions of the viscous flow behavior (skin friction and flow separation). Wind – tunnel tests were then conducted to verify the computer-designed profiles and to obtain the definitive airfoil properties. Out of this work first came the general aviation— Whitcomb [GA(W) — 1] airfoil, which has since been redesignated the LS(1)-0417 airfoil. The shape of this airfoil is given in Figure 4.30, obtained from Reference 16. Note that it has a large leading-edge radius (0.08c in comparison to the standard 0.02c) in order to flatten the usual peak in pressure coefficient near the nose. Also, note that the bottom surface near the trailing edge is cusped in order to increase the camber and
 When first introduced, this airfoil was labeled the GA (W)-l airfoil, a nomenclature which has now been superseded. (From Reference 16.)
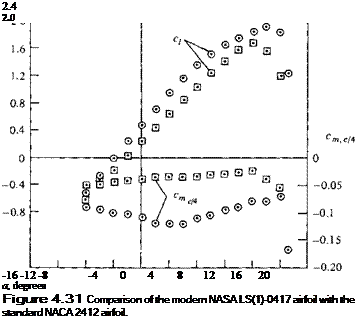
hence the aerodynamic loading in that region. Both design features tend to discourage flow separation over the top surface at high angle of attack, hence yielding higher values of the maximum lift coefficient. The experimentally measured lift and moment properties (from Reference 16) are given in Figure 4.31, where they are compared with the properties for an NACA 2412 airfoil, obtained from Reference 11. Note that Q. max for the NASA LS(1)-0417 is considerably higher than for the NACA 2412.
The NASA LS(1)-0417 airfoil has a maximum thickness of 17 percent and a design lift coefficient of 0.4. Using the same camber line, NASA has extended this airfoil into a family of low-speed airfoils of different thicknesses, for example, the NASA LS(l)-0409 and the LS(1)-0413. (See Reference 17 for more details.) In comparison with the standard NACA airfoils having the same thicknesses, these new LS(l)-04xx airfoils all have:
1. Approximately 30 percent higher c/imax•
2. Approximately a 50 percent increase in the ratio of lift to drag (L/D) at a lift coefficient of 1.0. This value of q = 1.0 is typical of the climb lift coefficient for general aviation aircraft, and a high value of L/D greatly improves the climb
 |
© NASA LS(1)0417 (ref. 16), Re = 6.3 X 10⁶ 0 NACA 2412 (ref. 11), Re = 5.7 X 10⁶
performance. (See Reference 2 for a general introduction to airplane performance
and the importance of a high L/D ratio to airplane efficiency.)
It is interesting to note that the shape of the airfoil in Figure 4.30 is very similar to the supercritical airfoils to be discussed in Chapter 11. The development of the supercritical airfoil by NASA aerodynamicist Richard Whitcomb in 1965 resulted in a major improvement in airfoil drag behavior at high subsonic speeds, near Mach 1. The supercritical airfoil was a major breakthrough in high-speed aerodynamics. The LS(1)-0417 low-speed airfoil shown in Figure 4.30, first introduced as the GA(W)-1 airfoil, was a later spin-off from supercritical airfoil research. It is also interesting to note that the first production aircraft to use the NASA LS( 1 )-0417 airfoil was the Piper PA-38 Tomahawk, introduced in the late 1970s.
 |
In summary, new airfoil development is alive and well in the aeronautics of the late twentieth century. Moreover, in contrast to the purely experimental development of the earlier airfoils, we now enjoy the benefit of powerful computer programs using panel methods and advanced viscous flow solutions for the design of new airfoils. Indeed, in the 1980s NASA established an official Airfoil Design Center at The Ohio State University, which services the entire general aviation industry with over 30 different computer programs for airfoil design and analysis. For additional information on such new low-speed airfoil development, you are urged to read Reference 16, which is the classic first publication dealing with these airfoils, as well as the concise review given in Reference 17.
|
|
|
|
|
|
|
|

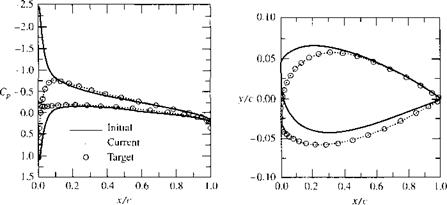
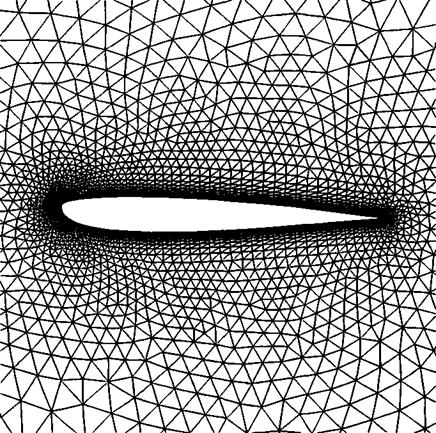
that supports the specified pressure distribution is obtained, as given by the circles in Figure 4.33b. The initial airfoil shape is also shown in constant scale in Figure 4.32.
The results given in Figures 4.32 and 4.33 are shown here simply to provide the flavor of modern airfoil design and analysis. This is reflective of the wave of future airfoil design procedures, and you are encouraged to read the contemporary literature in order to keep up with this rapidly evolving field. However, keep in mind that the simpler analytical approach of thin airfoil theory discussed in the present chapter, and especially the simple practical results of this theory, will continue to be part of the whole “toolbox” of procedures to be used by the designer in the future. The fundamentals embodied in thin airfoil theory will continue to be part of the fundamentals of aerodynamics and will always be there as a partner with the modern CFD techniques.


