Pitot Tube: Measurement of Airspeed
In 1732, the Frenchman Henri Pitot was busy trying to measure the flow velocity of the Seine River in Paris. One of the instruments he used was his own invention—a strange-looking tube bent into an L shape, as shown in Figure 3.11. Pitot oriented one of the open ends of the tube so that it faced directly into the flow. In turn, he used the pressure inside this tube to measure the water flow velocity. This was the first time in history that a proper measurement of fluid velocity was made, and Pitot’s invention has carried through to the present day as the Pitot tube—one of the most common and frequently used instruments in any modern aerodynamic laboratory. Moreover, a Pitot tube is the most common device for measuring flight velocities of airplanes. The purpose of this section is to describe the basic principle of the Pitot tube.5
Consider a flow with pressure p moving with velocity V. as sketched at the left of Figure 3.11. Let us consider the significance of the pressure p more closely. In Section 1.4, the pressure is associated with the time rate of change of momentum of the gas molecules impacting on or crossing a surface; that is, pressure is clearly related to the motion of the molecules. This motion is very random, with molecules moving in all directions with various velocities. Now imagine that you hop on a fluid
5 See chapter 4 of Reference 2 for a detailed discussion of the history of the Pitot tube, how Pitot used it to overturn о basic theory in civil engineering, how it created some controversy in engineering, and how it finally found application in aeronautics.
![]()
Static pressure A /measured here
yy>//777;77^ " 7^7777777^
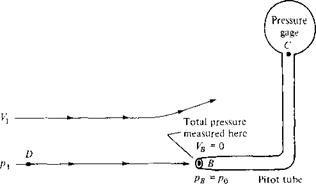
Figure 3.1 1 Pitot tube and a static pressure orifice.
element of the flow and ride with it at the velocity V. The gas molecules, because of their random motion, will still bump into you, and you will feel the pressure p of the gas. We now give this pressure a specific name: the static pressure. Static pressure is a measure of the purely random motion of molecules in the gas; it is the pressure you feel when you ride along with the gas at the local flow velocity. All pressures used in this book so far have been static pressures; the pressure p appearing in all our previous equations has been the static pressure. In engineering, whenever a reference is made to “pressure” without further qualification, that pressure is always interpreted as the static pressure. Furthermore, consider a boundary of the flow, such as a wall, where a small hole is drilled perpendicular to the surface. The plane of the hole is parallel to the flow, as shown at point A in Figure 3.11. Because the flow moves over the opening, the pressure felt at point A is due only to the random motion of the molecules; that is, at point A, the static pressure is measured. Such a small hole in the surface is called a static pressure orifice, or a static pressure tap.
In contrast, consider that a Pitot tube is now inserted into the flow, with an open end facing directly into the flow. That is, the plane of the opening of the tube is perpendicular to the flow, as shown at point В in Figure 3.11. The other end of the Pitot tube is connected to a pressure gage, such as point C in Figure 3.11 (i. e., the Pitot tube is closed at point C). For the first few milliseconds after the Pitot tube is inserted into the flow, the gas will rush into the open end and will fill the tube. However, the tube is closed at point C; there is no place for the gas to go, and hence after a brief period of adjustment, the gas inside the tube will stagnate; that is, the gas velocity inside the tube will go to zero. Indeed, the gas will eventually pile up
and stagnate everywhere inside the tube, including at the open mouth at point B. As a result, the streamline of the flow that impinges directly at the open face of the tube (streamline DB in Figure 3.11) sees this face as an obstruction to the flow. The fluid elements along streamline DB slow down as they get closer to the Pitot tube and go to zero velocity right at point B. Any point in a flow where V = 0 is called a stagnation point of the flow; hence, point В at the open face of the Pitot tube is a stagnation point, where VB = 0. In turn, from Bernoulli’s equation we know the pressure increases as the velocity decreases. Hence, pB > p. The pressure at a stagnation point is called the stagnation pressure, or total pressure, denoted by po- Hence, at point В, рв = po-
From the above discussion, we see that two types of pressure can be defined for a given flow: static pressure, which is the pressure you feel by moving with the flow at its local velocity Vj, and total pressure, which is the pressure that the flow achieves when the velocity is reduced to zero. In aerodynamics, the distinction between total and static pressure is important; we have discussed this distinction at some length, and you should make yourself comfortable with the above paragraphs before proceeding further. (Further elaboration on the meaning and significance of total and static pressure will be made in Chapter 7.)
 |
||
How is the Pitot tube used to measure flow velocity? To answer this question, first note that the total pressure po exerted by the flow at the tube inlet (point В) is impressed throughout the tube (there is no flow inside the tube; hence, the pressure everywhere inside the tube is po). Therefore, the pressure gage at point C reads Po – This measurement, in conjunction with a measurement of the static pressure p at point A, yields the difference between total and static pressure, po — Pi, and it is this pressure difference that allows the calculation of Vj via Bernoulli’s equation. In particular, apply Bernoulli’s equation between point A, where the pressure and velocity are p and V, respectively, and point B, where the pressure and velocity are po and V = 0, respectively:
Solving Equation (3.33) for Vj, we have
 [3.34]
Equation (3.34) allows the calculation of velocity simply from the measured difference between total and static pressure. The total pressure po is obtained from the Pitot tube, and the static pressure p is obtained from a suitably placed static pressure tap.
It is possible to combine the measurement of both total and static pressure in one instrument, a Pitot-static probe, as sketched in Figure 3.12. A Pitot-static probe measures po at the nose of the probe and p at a suitably placed static pressure tap on the probe surface downstream of the nose.
In Equation (3.33), the term Vj2 is called the dynamic pressure and is denoted by the symbol q. The grouping pV2 is called the dynamic pressure by definition
|
and is used in all flows, incompressible to hypersonic:
q = pV2
However, for incompressible flow, the dynamic pressure has special meaning; it is precisely the difference between total and static pressure. Repeating Equation (3.33), we obtain
|
P + |
pVi = |
Po |
|
|
static |
dynamic |
total |
|
|
pressure |
pressure |
pressure |
|
|
or |
pi |
+ q – po |
|
or |
|
qі = Po ~ Pi |
[3.35]
It is important to keep in mind that Equation (3.35) comes from Bernoulli’s equation, and thus holds for incompressible flow only. For compressible flow, where Bernoulli’s equation is not valid, the pressure difference p0 — p is not equal to q. Moreover, Equation (3.34) is valid for incompressible flow only. The velocities of compressible flows, both subsonic and supersonic, can be measured by means of a Pitot tube, but the equations are different from Equation (3.34). (Velocity measurements in subsonic and supersonic compressible flows are discussed in Chapter 8.)
At this stage, it is important to repeat that Bernoulli’s equation holds for incompressible flow only, and therefore any result derived from Bernoulli’s equation also holds for incompressible flow only, such as Equations (3.26), (3.32), and (3.34). Experience has shown that some students when first introduced to aerodynamics seem to adopt Bernoulli’s equation as the gospel and tend to use it for all applications, including many cases where it is not valid. Hopefully, the repetitive warnings given above will squelch such tendencies.
![]() An airplane is flying at standard sea level. The measurement obtained from a Pitot tube mounted on the wing tip reads 2190 lb/ft2. What is the velocity of the airplane?
An airplane is flying at standard sea level. The measurement obtained from a Pitot tube mounted on the wing tip reads 2190 lb/ft2. What is the velocity of the airplane?
Solution
Standard sea level pressure is 2116 lb/ft2. From Equation (3.34), we have
![]()
![]() 2(po-Pi) = /2(2190 — 21167 p V 0.002377
2(po-Pi) = /2(2190 — 21167 p V 0.002377
In the wind-tunnel flow described in Example 3.4, a small Pitot tube is mounted in the flow just upstream of the model. Calculate the pressure measured by the Pitot tube for the same flow conditions as in Example 3.4.
![]() Solution
Solution
From Equation (3.35),
Po — Poo “Ь Чоо — Poo “h 2 Poo
= 2116+ 4(0.002377)(328.4)2
![]() = 2116+ 128.2 =
= 2116+ 128.2 =
Note in this example that the dynamic pressure is ^Дх> = 128.2 lb/ft2. This is only 8 percent larger than the pressure difference (p — /+), calculated in Example 3.4, that is required to produce the test-section velocity in the wind tunnel. Why is (pi — po) so close to the test-section dynamic pressure? Answer: Because the velocity in the settling chamber Vi is so small that p is close to the total pressure of the flow. Indeed, from Equation (3.22),
v’ = J[Vl = (їг) (328’4) = 213 ft/s
Compared to the test-section velocity of 328.4 ft/s, V is seen to be small. In regions of a flow where the velocity is finite but small, the local static pressure is close to the total pressure. (Indeed, in the limiting case of a fluid with zero velocity, the local static pressure is the same as the total pressure; here, the concepts of static pressure and total pressure are redundant. For example, consider the air in the room around you. Assuming the air is motionless, and assuming standard sea level conditions, the pressure is 2116 lb/ft2, namely, 1 atm. Is this pressure a static pressure or a total pressure? Answer: It is both. By the definition of total pressure given in the present section, when the local flow velocity is itself zero, then the local static pressure and the local total pressure are exactly the same.)
|
|
|
||
 |
|||
|
|||
|
|||
|


|
|
|
|
|
|
|
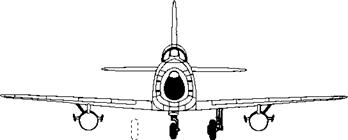
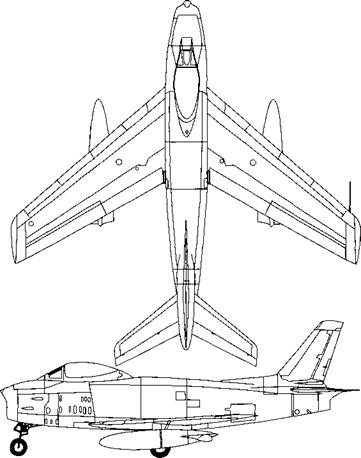
Figure 3.15 Three-view of the North American F-86H. Note the wing-mounted Pitot-static tube. |
|
|
|
|
|
|
|
|
