APW excitation
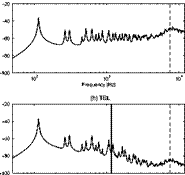
The effects produced by the acoustic plane wave excitations are considered first. The three lines in plots (a) and (b) of Figure 11 show the spectra of the time – averaged total kinetic energy and total radiated sound power by the panel due to acoustic plane waves at grazing, 45o and normal angles of incidence as depicted in Figure 9a. Considering first the kinetic energy plot (a), the three lines show that, at low frequency the spectra are characterised by sharp and well separated peaks due to the natural modes of the panel. The spectrum for the acoustic plane wave excitation with normal angle of incidence (dotted line) is characterised by fewer resonance peaks, as this type of wave excites only the modes with a net non-zero volumetric displacement, that is modes with both odd mode orders. At frequencies above the first resonance frequency of the panel, the mean kinetic energy spectra tend to fall with a typical 6 dB/octave slope, i. e. the so called “mass law”, which is due to the mass effect of the panel. As the frequency rises, the resonance peaks in the kinetic energy spectra progressively overlap so that the spectra show wide rounded crests spaced out by wide troughs, which are due to the clustering of many resonance peaks at given frequency bands. This effect is specific to the structure at hand and is quantified by the “modal overlap” factor
|
(a) APW |
![APW excitation Подпись: Frequency [Hz] (e) ROR 20 Frequency [Hz]](/img/3129/image996.gif) |
 |
|
(c)ADF |
|
-40 |
|
-60 |
|
-80 |
|
00 |
|
0 |
|
10 Frequency [Hz] |
|
0 |
Figure 11. Spectra of the total kinetic energy (left-hand side plots) and total radiated sound power (right-hand side plots) per unit exciation due to (a, b) APWat grazing (dashed line) 45o (thick-solid line) and normal (faint-solid line) angles of incidence; (c, d) ADF; (e, f) ROR and (g, h) TBL pressure fields.
(Cremer et al. 1988), which gives the number of structural modes of the structure significantly excited at any one excitation frequency. For instance, the modal overlap for thin rectangular plates increases linearly with frequency and is given by
![]()
![]() m
m
p
V Bp J
where np(fi) is the plate “modal density”. For the plate considered in this section
the modal overlap reaches the threshold value of 1 at about 3.6 kHz. Starting from this frequency, the response of the panel at each frequency is characterised by the overlap of two or more resonant responses. For frequencies above 5 kHz, the kinetic energy spectra produced by the grazing (dashed line) and 45o (thick – solid line) acoustic plane waves show distinct wide frequency band ridges, which are characterised by multiple resonance peaks. These phenomena are generated by the so called “coincidence effect” where the projection of the acoustic wavelength into the plane of the panel equals the frequency-dependent bending wavelength, i. e. 4/sin0 = Xb, and thus the waved pressure field produced on the plate by the incident acoustic plane wave couples effectively with the structural wave motion (Fahy and Gardonio 2007). Consequently, for frequencies close to the “acoustic coincidence frequency” a>m, such that 4/sin0 = 4b, the response of
the panel increases and forms the wide frequency band crests with multiple resonance peaks that can be seen in the kinetic energy spectra produced by the grazing and 45o incident acoustic waves (dashed and thick-solid lines respectively). Since for acoustic waves 2x/k, with the wavenumber given by
k = , and since for thin plates Xb = 2njkb, with the wavenumber given by
kb =^cb =^[a{rnpjBpthe acoustic coincidence frequency can be readily derived as follows:
where
( Y/2
![]()
![]() mP
mP
v B? J is the so called “critical frequency”, which is highlighted with the thick-dashed vertical lines in the plots of Figure 11 and represents the smallest coincidence frequency that occurs for acoustic waves incident at grazing angle, that is 0=9C°. For the panel at hand, the critical frequency occurs at about 7.54 kHz. Eq. (81) indicates that the coincidence frequency tends to infinity as 0^0, thus as the acoustic wave approaches normal angle of incidence. Indeed the kinetic energy spectra produced by the normal acoustic plane wave excitation (faint-solid line) do not show the wide frequency band ridge found for the grazing and 45o excitations (dashed and thick-solid lines respectively). Normally, the coincidence phenomenon between flexural waves in the structure and acoustic waves in the
|
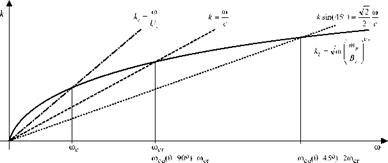
Figure 12. Dispersion curves relative to a) flexural waves in a thin plate (solid line), b) acoustic trace wave for grazing incidence (dashed line), c) acoustic trace wave for 45o incidence and d) convective flow (dash-dotted line). |
fluid is analysed with reference to the dispersion curves for the two types of waves. For instance, Figure 12 shows that the dispersion curve for the trace of the acoustic wave at grazing angle with the panel (dashed line) intersects the dispersion curve for flexural wave propagating in the plate (solid line) exactly at the critical frequency, so that coco(0=90)=a)cr. Moreover, the dispersion curve for the trace of the acoustic wave at 45o with the panel (dotted line) intersects the dispersion curve for flexural wave propagation on the thin plate (solid line) at higher frequency than the critical frequency, that is rnco (0 = 45°) = 2a>cr. Moving
back to plot (a) of Figure 11, the dashed and thick-solid lines show that for very high frequencies above the coincidence region, the mean kinetic energy spectrum falls rapidly with a typical 18 dB/octave slope, i. e. following the so called “stiffness law”, which is due to the bending stiffness effect of the panel (Fahy and Gardonio 2007).
Considering now plot (b) in Figure 11, it is noted that the spectra of the radiated sound power by the panel due to acoustic plane waves at grazing, 45o and normal angles of incidence (dashed, thick-solid, faint-solid lines respectively) are similar to those found for the kinetic energy. However, at low frequencies where the spectra of the kinetic energy are characterised by well separated resonance peaks, the co-respective spectra of the radiated sound power are characterised by fewer resonance peaks. This is because, as discussed in Section 2.1, at low frequencies such that k/kb <1, the natural modes characterised by one or both even mode orders are poor sound radiators. As a result the resonant vibration responses due to those natural modes do not turn into a high sound radiation. For example the resonant responses due to the (1,2) and (2,1) natural modes of the panel produce the second and third sharp resonance peaks in the kinetic energy spectra and the comparatively much smaller second and third resonance peaks in the radiated sound power spectra. For frequencies above the first resonance frequency of the panel, the spectra of the mean radiated sound power tend to fall following the so called mass law, i. e. with a typical 6 dB/octave slope. As found for the kinetic energy spectra, at higher frequencies where the response of the panel at every frequency is characterised by the overlap of multiple modes the sound radiation spectra are characterised by increasingly smoother wide frequency band crests and troughs, which are generated by the resonant response of clusters of natural modes. When the frequency approaches the critical frequency at about 7.54 kHz (highlighted by the thick-dashed vertical line), in all three cases under consideration the sound radiation tends to rise. This is due to the fact that к/кь ~1 and thus, as can be noted in Figure 8a, all modes become efficient sound radiators. In particular, when the plate is excited by the plane wave at grazing angle (dashed line), this phenomenon is magnified by the concomitant efficient acoustic excitation effect described above. Thus, the coincidence ridge in the sound radiation spectrum becomes very high. Alternatively, when the plate is excited by the plane wave with a 45o angle of incidence, the spectrum is characterised by a small crest around the critical frequency, which is due to the efficient sound radiation of all modes, and then, at higher frequencies, by another comparatively bigger ridge, which is due to the efficient excitation of the waved pressure field generated on the panel by the acoustic plane wave. Finally, the radiated sound power spectrum of the plate excited by the plane wave with normal angle of incidence (faint-solid line) is characterised only by a small ridge around the critical frequency due to the efficient sound radiation of all modes.


