Cone-Flow Experiment: Amplification of the Second Instability Mode by Cooling
In Section 8.1.4 the influence of the Mach number and the thermal state of the surface on the stability of high-speed boundary layers was discussed. In Fig. 8.5 the influence of wall cooling on the first and the second (Mack) instability mode was shown with theoretical/numerical results of E. Kufner.
New experimental results regarding the influence of the wall temperature on boundary-layer instability and transition of S. Willems and A. Gulhan at DLR Cologne, Germany generously were made available for this book [6].
The experiments were performed in DLR’s hypersonic wind tunnel H2K (air) with a 7° half-angle cone model with two different nose radii (rN = 0.1 mm and 2.5 mm). The model length accordingly is 732.3 mm and 715.0 mm. In a segment between 130 mm and 320 mm—the middle segment— different surface temperatures from Tw = 203 K to Tw = 523 K are set with a temperature-controlled oil flow through a hypocaust in the model. The flow parameters for the case presented here are given in Table 10.4.
|
Table 10.4. Parameters of the cone-flow experiment [6]. The recovery factor used is r = 0.854.
|
On the model’s rear segment between 320 mm and the end of the cone the surface temperature was measured with infrared cameras. The high-speed static pressure fluctuation measurements were made with PCB piezo pressure sensors.
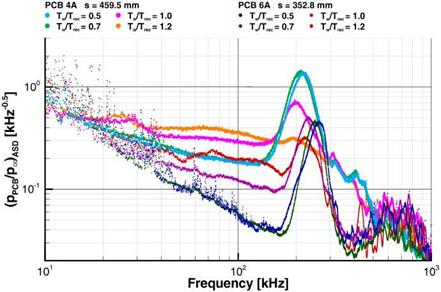
Fig. 10.3 gives pressure spectra found at two locations on the rear segment of the sharp cone. The locations measured from the nose tip are s = 352.8 mm and 459.5 mm.6
|
Fig. 10.3. Influence of the wall temperature Tw on the spatial amplification rates (PCB spectra) of the second instability mode in the boundary layer at a sharp (tn = 0.1 mm) 7° half-angle cone [6]. Shown are the spectra for several ratios Tw /Trec for a = 0° at two locations with distances from the nose tip s = 352.8 mm and 459.5 mm. |
The second (Mack) instability modes show amplitudes which in general clearly become larger with lower wall temperatures. This holds for both locations on the cone. (The transition process is completed at s ~ 500 mm for the highest and at s « 600 mm for the lowest wall temperature.) The results— also the other results from [6] not shown here—are in accordance with Mack’s result that surface cooling amplifies the second instability mode, Sub-Section 8.1.4.
These experimental results also corroborate qualitatively Kufner’s the – oretical/numerical results from the year 1995. Qualitatively only, because Mach number and unit Reynolds number were different, the cone was blunt, the ratios Tw/Trec, however, covered a similar range. The frequency ranges of the second modes are of the same order of magnitude. In any case, both the theoretical/numerical and the experimental results show that and how thermal surface effects influence instability/transition mechanisms. The thermal state of the surface is an important parameter.


