Elementary Wind Models
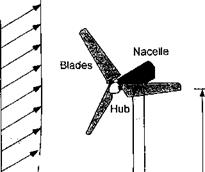
Primary aerodynamic factors affecting power output from the wind turbine are the wind speed, the equivalent density altitude at which the turbine operates, and the tower height, that is, the height of the turbine (measured by its shaft position) off the ground in the ground surface boundary layer. Additional factors include the likelihood of large amplitude fluctuations in wind speed (gusts) and the associated turbulence in the wind. Altitude and temperature affects the density of the air flowing through the turbine, and the effect on power output can be calculated using the standard atmospheric model given in Section 5.2. The height of the tower, h, is important because the turbine operates within the atmospheric boundary layer at the ground, which can have a substantial velocity gradient depending on the upstream terrain – see Fig. 13.8. The effect of this boundary layer is to reduce the mass flow through the turbine and so reduce its power output. The consideration of this effect is very important for choosing the site for the wind turbine. To size the rotor it is necessary to know the energy content of the winds at the proposed site and at the proposed height of the
Figure 13.8 A wind turbine operates in an atmospheric boundary layer.
turbine off the ground. Such data must be acquired over many years to establish confidence that the proposed site will indeed provide the average power desired from the turbine (or wind farm). Wind data is often measured in advance at proposed sites or is obtained by using historical wind data published in handbooks such as that compiled by Frost et al. (1978). So-called wind maps are often prepared using both measured data and statistical models.
In practice, two models are most often used to represent the variation of wind speed characteristics with height: the power law and the logarithmic law. The power law is written as
![]()
 |
||
 |
||
(13.20)
where ftref is a defined reference height, which is usually taken to be 10 m (32.8 ft) above the ground. It seems common to assume either that m = 1/6 or m = 1/7, so it will be apparent that the average power output from the turbine will increase with h1/2 or ft3/7, respectively. The logarithmic law also includes a roughness length zo representing the character of the terrain upstream of the turbine such that
These results are valid only for flat sites and where the atmosphere is not subjected to strong convection or thermal stratification effects. There are other types of models used for hill sites.
In addition to the effects on the mean wind speed there are also stochastic variations in wind speed, because of turbulence, which will affect the power output from the wind turbine. Such variations have been measured using anemometers and the data have been developed into statistical models. It is usual to represent the wind speed as an average (or mean) component U plus a temporal or fluctuating component u, that is,
![]() Voo(f) = U + u(t).
Voo(f) = U + u(t).
|
||||||||||||||||
|
||||||||||||||||
|
||||||||||||||||
|
||||||||||||||||
|
||||||||||||||||
|
||||||||||||||||
|
||||||||||||||||
|
||||||||||||||||
|
||||||||||||||||
|
||||||||||||||||
|
|
|||||||||||||||
|
||||||||||||||||
|
|


