Flow Separation on Wings with Unswept Leading Edge—Experimental Observations
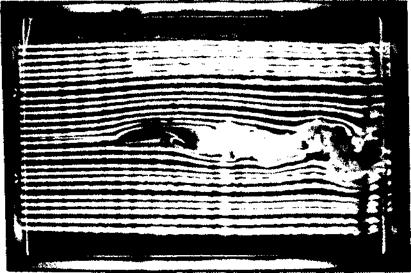
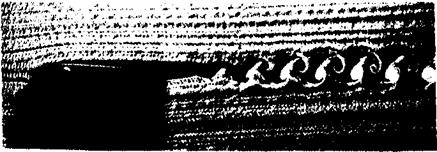
Flow visualization-based observations on two-dimensional airfoils indicate that when the angle of attack increases to the point where flow separation is initiated, a shear layer forms near the separation point. The vorticity in this layer seems to have a clockwise value, whereas the shear layer emanating from the trailing edge (wake) mostly has a counterclockwise vorticity (see schematic description in section AA of Fig. 14.27). These two layers roll up in opposite directions and eventually a periodic wake rollup pattern is observed (Fig. 14.28). This instability of the two shear layers originating from the upper and lower surface boundary layers is present even at zero angle of attack and results of flow visualizations14 21 with the hydrogen bubble technique are shown in Fig. 14.29. The first and most important observation is, then, that even for a stationary airfoil, when the flow separates, the problem becomes time – dependent. The frequency of this wake oscillation can be related to the wake spacing by the Strouhal number (Eq. (1.52)), which was observed to have values of approximately
1-0.2 (14.13)
oc
Here d is the spacing between the two shear layer separation points (shown in section AA in Fig. 14.27) and / is the shedding frequency. Time-dependent chordwise pressure measurements on a stalled airfoil are scarce, but a typical
|
FIGURE 14.28 Smoke trace flow visualization of the separated flow over a two-element airfoil [Re = 0.3 x 10⁶). |
time-averaged pressure distribution is shown in Fig. 14.30. The time-averaged effect of the flow separation is to reduce the lift (reduced circulation) and the pressure stays fairly constant in the region starting behind the separation point and ending at the trailing edge. Note the large difference between the attached, potential-flow calculations taken from Ref. 14.22 and the experimental results of the separated flow.
|
FIGURE 14.29 Hydrogen bubble flow visualization of the wake (created by the two shear layers of the boundary layer) behind NACA 0012 airfoil at ar = 0 and Rec = 21,000. (Courtesy of K. W. McAlister and L. W. Carr,14 21 U. S. Army Aeroflightdynamics Directorate, AVSCOM.) |
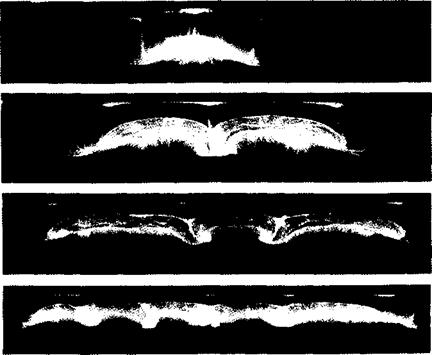
Surface oil flow visualizations14 23 with rectangular, finite aspect ratio wings (Fig. 14.31) indicate that in reality there is no “true two-dimensional flow separation.” Instead there are three-dimensional cells and at the central plane of each cell a flowfield similar to the ‘two-dimensional separation” of Fig. 14.27 AA and Fig. 14.28 can be observed. These cells seem to have some natural aspect ratio, which will adjust itself slightly to the actual wing planform shape. For example, for a rectangular wing with aspect ratio (Ж) of 3, one cell was visible; for Ж = 6 and 9 two and three cells were visible, respectively. When the wing span was further increased (to Ж = 12), five cells were observed and the size of some of the cells was somewhat smaller. In conclusion, therefore, the unswept leading edge problem appears to be always three-dimensional and time-dependent—and from the experimental point of view still not completely explored.
In the following section some of the modeling efforts for such flows, based on inviscid models, is presented. It is assumed that if the separated shear layer can be modeled then the rest of the flowfield is still close to being irrotational and therefore the pressures and loads can be estimated.
|
FIGURE 14.31 Oil flow patterns developed on the upper surface of several stalled rectangular wings. For all wings angle of attack is a = 18.4°, Rec = 385,000, and the airfoil shape is a 14% Clark Y section. (Courtesy of A. Winkelman.14 23) Reprinted with permission. Copyright AIAA. |


