Passive Treatments to Reduce Sound Radiation
The previous section has shown that the sound radiated to the interior of a distributed thin wall structure is a complex phenomenon that depends on the characteristics of the excitation field, the flexural response of the structure and the radiation properties of the structure. Normally, for a NVH[30] engineer it is rather difficult to work on the excitation and sound radiation aspects in a transportation vehicle, since they strongly depend on the operation conditions and interior design of the vehicle. Thus, the most common option left to reduce noise transmission to the interior is to modify the flexural response of the body of the vehicle. In general, the flexural response of a thin structure is determined by three parameters: a) the mass per unit area, b) the flexural stiffness and c) the structural or fluid damping. Normally structural energy dissipation is modelled
by considering a complex modulus of elasticity E = E(1+jrj), where n is the
(a) mass tretment
 |
increased density: Pp>Pp
Figure 13. Sound radiation induced by a TBL pressure field acting on a panel
with (a) mass treatment; (b) stiffness treatment and (c) damping treatment.
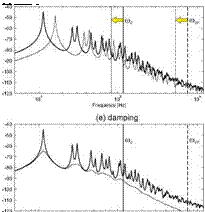
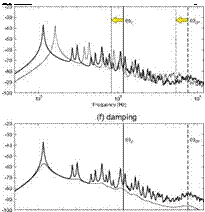
loss factor (Cremer et al. 1988; Fahy and Gardonio 2007). As discussed in Section 1.5, the energy dissipation arising from the fluid loading on the structure is a complex phenomenon, which however, for light fluids can be modelled in terms of modal damping ratios. In practice, the implementation of passive sound insulation treatments always produces a combination of mass, stiffness and damping effects. However, the treatment can be focused on one of the three properties and described as a mass, or stiffness, or damping treatment. Thus, as schematically depicted in Figure 13, in this section the sound radiation of the panel excited by the TBL pressure field considered in the previous section is analysed with reference to variations in turn of the density (mass-treatment), Young modulus of elasticity (stiffness treatment) and structural loss factor (damping treatment) of the panel. Figure 14 shows the spectra for the total kinetic energy PSD (left-hand side plots a, c, e) and total radiated sound power PSD (right-hand side plots b, d, f) in presence of mass (plots a, b), stiffness (plots c, d) and damping (plots e, f) treatments. The thick-solid lines in the plots show the kinetic energy and radiated sound power spectra for the reference panel considered in the previous section. The solid faint lines show the spectra when one of the three properties are varied. Also, the variations of the acoustic coincidence frequency (thick-dashed vertical line) and convective coincidence frequencies (thick-solid vertical line) are indicated by a thin-dashed vertical line and a thin-solid vertical line respectively.
The effect of increasing by a factor 2 the mass density of the panel is analysed first. Plots (a) and (b) show that the first few resonance frequencies shift to lower values. Also, the transition from a spectrum with well separated resonance frequencies to a smoother spectrum characterised by the overlap of multiple resonant modes at each frequency occurs at lower frequencies. In fact, according to Eq. (80), the modal overlap grows more rapidly with frequency as the mass density is increased. The thick-solid (for the reference panel) and faint – solid (for the heavier panel) vertical lines in the two plots highlight that the increment of mass density shifts to higher frequencies the convective coincidence effect. In particular, as can be deduced from Eq. (83), the convective coincidence frequency of the reference panel at about 1.17 kHz is increased by a factor ^m’p/mp = 42 to about 1.65 kHz for the panel with double density. At
higher frequencies the spectra for the reference and heavier panels become increasingly smoother. It is interesting to note that the levels of the two spectra for the kinetic energy nearly coincide while the levels of the two spectra for the radiated sound power are about 6 dB apart. This discrepancy between the two plots should not mislead the reader. In fact, the kinetic energy plot gives the level of the response of the panel weighted by the mass of the panel. Thus, if the spectrum of the spatially averaged squared transverse velocity PSD was plotted,
 |
 |
Figure 14. PSD of the total kinetic energy (left-hand plots) and total radiated sound power (right-hand plots) per unit turbulent boundary layer pressure field PSD. Thick solid lines reference panel; faint solid lines (a, b) panel with double mass density; (c, d) panel with double Young’s modulus; (e, f) panel with ten times higher loss factor. Solid and dashed vertical lines identify the convective coincidence frequency and acoustic critical frequency for the reference panel (thick-lines) and for the panel with passive treatments (faint-lines).
when Np > 1, the two spectra for the reference and heavier panel would be
separated by a factor proportional to mp/m’p = 1/2, which corresponds to -6 dB.
Finally, considering the spectra for the radiated sound power PSD in plot (b), it is noted that, when the panel density is increased, the typical wide band ridge due to efficient sound radiation of all modes of the panel is shifted up in frequency. In fact, according to Eq. (82) the critical frequency for the heavier
panel is increased by a factor ^mpjmp = 42 with respect to that of the reference
panel. Thus, as highlighted by the thick-dashed and thin-dashed vertical lines in plot (b), the critical frequency of the reference panel at about 7.54 kHz is shifted up to about 10.67 kHz for the heavier panel.
The effect of increasing by a factor 2 the panel material Young’s modulus of the panel is considered next. Plots (c) and (d) of Figure 14 show that the increased stiffness of the panel shifts the resonance frequencies of the fundamental and low order modes of the panel to higher values. Also, the transition from a spectrum with well separated resonance frequencies to a smoother spectrum occurs at relatively higher frequencies. This is because, as can be deduced from Eq. (80), when the stiffness of the panel is increased, the modal overlap factor grows less rapidly with frequency. The thick-solid and faint-solid vertical lines in the two plots indicate that, when the stiffness of the panel is increased, the convective coincidence effect in the two spectra is shifted down from about 1.17 kHz to about 826 Hz. In fact, according to Eq. (83), the convective coincidence frequency of the stiffer panel is varied by a factor proportional to pp/B’p = 1/V2 . At higher frequencies, where Np > 1 and thus
the two spectra become increasingly smoother, the spectrum of the kinetic energy of the stiffer panel is about 3 dB lower than that of the reference panel, while the levels of the spectra of the radiated sound power for the reference and stiffer panel are the same. Finally, the spectra for the radiated sound power in plot (d), show that, in this case, the typical wide band ridge due to efficient sound radiation of all modes of the panel is shifted down in frequency. In fact, according to Eq. (82) the critical frequency for the stiffer panel is varied by a factor ifBjB’P = 1/V2 with respect to that of the reference panel. Thus, as
highlighted by the thick-dashed and faint-dashed vertical lines in plot (d), the critical frequency of the reference panel at about 7.54 kHz is shifted down to about 5.33 kHz for the stiffer panel.
At last, the effect of increasing by a factor 10 the material loss factor of the panel is considered. According to Eqs. (82) and (83), damping has no effects on the acoustic and the convective coincidence phenomena. Thus the thick and faint solid or dashed vertical lines shown in plots (e) and (f) overlap. The two graphs also show that the damping does not shift the resonance frequencies of the lower order modes. However, as can be deduced from Eq. (80), damping has an important effect on the modal overlap factor. In particular, the doubling of the loss factor produces a doubling of the overlap factor so that the transition from a response characterised by well separated resonances to a smoother spectrum characterised by the overlap of multiple modes is shifted to lower frequencies. The spectra in plots (e) and (f) show that the increment of damping in the panel also reduces the amplitudes of the resonance peaks, due to the fundamental and low order modes, which are still well separated from each other. Finally, the two plots show how an increase in the loss factor effectively reduces the levels of the spectra of the kinetic energy and radiated sound power as the frequency rises. For instance, when the frequency approaches the critical frequency at about 7.54 kHz, both the kinetic energy and the radiated sound power spectra have fallen by about 10 dB in contrast to the values for the reference panel.
In summary, adding mass to a partition produces two important beneficial effects: first it reduces the level of the response and sound radiation and second it moves to higher frequencies the convective and acoustic coincidence effects. This second effect is particularly important since human annoyance to noise is particularly important at mid audio frequencies, thus in the range from 1 to 4 kHz. Increasing the stiffness of the partition shifts to higher frequencies the resonances of the fundamental and lower order modes of the panel. However it has little effects on the level of the response and radiated sound power and, more importantly, it tends to shift to lower frequencies the convective and acoustic coincidence effects. This is a rather undesirable effect since it tends to compress the two coincidence phenomena towards the mid audio frequency range, which is particularly critical in terms of noise annoyance perception. Finally, increasing damping is generally beneficial although it normally affects the higher frequency portion of the spectrum where the response and sound radiation of the structure are in any case relatively low.


