Boundary-Layer Transition Detection
TSP was utilized as a technique for visualizing flow transition (Campbell et al. 1992; Campbell 1993; McLachlan et al. 1993b; Cattafesta et al. 1995; Asai et al. 1997b, 1997c). Since convection heat transfer is much higher in turbulent flow than in laminar flow, TSP can visualize a surface temperature difference between the laminar and turbulent flow regions. Typically, at low speeds, model (or flow) needs to be heated or cooled to generate a temperature change across the transition line. However, at higher Mach numbers, artificial heating is not necessary because friction heating is able to produce a significant temperature difference between the laminar and turbulent flow regions. Using EuTTA-dope TSP,
Campbell et al. (1992, 1993) visualized transition patterns on a Boeing symmetric airfoil and a symmetric NACA 654-021 airfoil in a low-speed wind tunnel and determined the dependency of the transition location on the angle of attack. In their experiments, the airfoil models were pre-heated to about 50oC with a spot lamp prior to a run to produce a sufficient temperature difference between the turbulent and laminar flow regions by subsequent convection cooling. McLachlan et al. (1993b) reported a similar transition detection experiment for a NACA – 64A010 airfoil using a proprietary TSP. Asai et al. (1997b) used a EuTTA-based TSP to visualize transition on a 10-degree cone model at the Mach numbers 1.62.5 in a quiet supersonic wind tunnel.
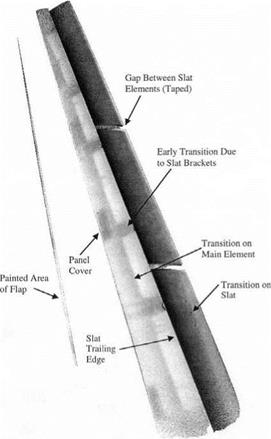
Transition detection was made using EuTTA-dope TSP for a trapezoidal wing (Trap Wing) semispan model at the Mach numbers 0.15-0.25 and Reynolds numbers 3.5×10⁶-15x106over a range of the angles of attack from -4° to 36° in the NASA Ames 12-Ft Pressure Wind Tunnel (Burner et al. 1999). The transition detection system consisted of three scientific-grade cooled CCD cameras, several flash UV lights for illumination, and a computer for data processing. EuTTA – dope TSP was coated on white paint stripes along the main wing, slat, and trailing edge flap of the upper wing surface. The white basecoat was used to enhance surface scattering and increase the luminescence emission from TSP. TSP was applied only on the slat and the first 20% of chord on the main wing and flap since previous testing of this model in the Langley 14×22 Ft tunnel had shown that transition would always occur upstream of these locations. TSP data were obtained with the three cameras viewing the slat, flap, and wingtip of the model. The following data acquisition procedure was used. The tunnel was first run for an extended period, without cooling, to raise the temperatures of the flow and the model. Reference images of the ‘hot’ model were taken at several different angles of attack (AoA). The cooling system was then activated, and ‘run’ images were taken over the same AoA sequence while the flow cooled. The cooling sequence generally required 2-3 minutes during which the flow temperature dropped at about 5 °R/minute. Internal model temperatures, measured with thermocouples, lagged the flow by from 2°R (slat) to 10°R in the main wing. Figure 10.8 shows a typical transition image of the slat and main wing of the Trap Wing in the landing configuration at the angle of attack of 24°, Mach 0.15, and the total pressure of 1 atm. Bright regions in the image were hot relative to dark regions. The slat was dark relative to the main wing because its smaller mass allowed it to follow more rapidly the drop in the flow temperature. Since the flow cooled the model, boundary layer transition was indicated by a sharp decrease in brightness in the image. This effect was seen clearly on the main wing where transition occurred at 10-15% chord except in the turbulent wakes behind the slat brackets.
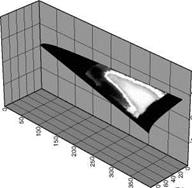
Using a Ruthenium-based TSP, Cattafesta et al. (1995b, 1996) conducted transition detection on several 3D models over a wide speed range in the NASA Langley Supersonic Low-Disturbance Tunnel. Figure 10.9 shows a heat transfer image mapped onto the half of the CFD model surface grid of a swept-wing model, visualizing transition on the model at Mach 3.5. The bright region corresponded to the turbulent boundary layer where the heat transfer rate was higher than that in the laminar boundary layer. The onset of transition was demarcated in the image as a bright parabolic band on the wing where the crossflow instability mechanism dominated the transition process. No transition was observed near the centerline of the model because near the symmetric plane of the model the stability was mainly controlled by the Tollmien-Schlichting instability mechanism that was weaker than the cross-flow instability mechanism.
|
Fig. 10.8. Transition image of the upper surface of the Trap Wing model at the angle of attack of 24° and Mach 0.15. From Burner et al. (1999) |
 X
X
Y (mm)
X (mm)
Fig. 10.9. Heat transfer image of transition on a half of a CFD grid of a swept-wing model at Mach 3.5. From Cattafesta et al. (1996)
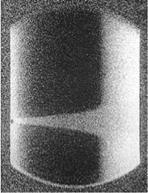
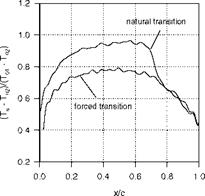
Cryogenic TSP formulations, originally developed at Purdue University, were used to detect transition on airfoils in the 0.1-m transonic cryogenic wind tunnel at the National Aerospace Laboratory (NAL) in Japan and the 0.3-m cryogenic wind tunnel at NASA Langley. In the NAL tests, two TSP formulations, Ru(trpy)- GP197 and Ru(VH127)-GP197, were used by Asai et al. (1996, 1997c) in a temperature range of 90-150 K for two NACA 64A012 airfoil models made of white glass ceramic (MACOR®) and stainless steel. The stainless steel model was covered with a thin white Mylar insulating layer to achieve a larger surface temperature variation. In these tests, the total temperature varied from 90 to 150 K, the Mach number from 0.4 to 0.7, and the Reynolds number based on the chord from 2.2 to 8.5 millions. In order to enhance a temperature difference across the transition line, Asai et al. (1996, 1997c) employed both a transient method of rapidly changing the freestream temperature and a steady internal heating method. A rapid change of the freestream temperature was achieved by injecting liquid nitrogen into the tunnel; the maximum temperature drop was about 7.5 K in 10 seconds. The CCD camera system used for cryogenic TSP transition detection was the same as that for cryogenic PSP measurements at NAL described in Chapter 9. Figure 10.10 shows a typical luminescent intensity ratio image of Ru(VH127)-GP197 TSP on the stainless steel NACA 64A012 airfoil model covered with a Mylar film at Mach 0.4 and the total temperature of 150 K, where flow was from left to right. Bright and dark regions represented high and low heat transfer, respectively. A turbulent wedge generated by a small roughness element placed near the leading edge was clearly visible as well as the natural transition line near 70% chord. Quantitatively, the surface temperature was calculated from the luminescent intensity using a priori calibration relation. Figure 10.11 shows the normalized chordwise surface temperature distributions at the natural and forced transition locations on the stainless steel model, where the total temperature was rapidly changed from 150 to 142.5 K by injecting liquid nitrogen to the tunnel. Natural transition was shown as a sudden decrease in the chordwise
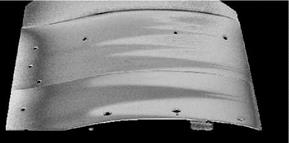
temperature distribution. Figure 10.12 shows transition images on the stainless steel airfoil model for different Reynolds numbers based on the chord at Mach 0.4. Using several cryogenic TSPs, Popernack et al. (1997) also detected boundary- layer transition on a laminar-flow airfoil model in the NASA Langley 0.3-m cryogenic wind tunnel. A typical transition image on this airfoil is shown in Fig.
10.13, clearly visualizing a number of turbulent wedges tripped by surface roughness and the natural transition location. Transition detection on a swept wing was recently made using cryogenic TSP in the European Transonic Wind Tunnel (ETW) (Fey et al. 2003).
|
Fig. 10.10. Relative luminescent intensity image indicating transition on a NACA 64A012 airfoil at Mach 0.4 in the NAL 0.1 m transonic cryogenic wind tunnel, responding to a decrease in the total temperature from T01 = 150 K to T02 = 142.5 K. From Asai et al. (1996) |
|
Fig. 10.11. Normalized chordwise surface temperature distributions in natural and forced transition regions on a NACA 64A012 airfoil at Mach 0.4 obtained from Figure 10.10. From Asai et al. (1996) |
|
Re=1.60xl06 Re=1.82xl06 Re=2,09xl06 Fig. 10.12. Transition images of a NACA 64A012 airfoil in the NAL 0.1 m transonic cryogenic wind tunnel for different Reynolds numbers at Mach 0.4. From Asai et al. (1996) |
|
Fig. 10.13. Transition image on a laminar-flow airfoil model in the NASA Langley 0.3 m cryogenic wind tunnel (flow from right to left). From Popernack et al. (1997) |


