Dynamic Stall
For an airfoil pitching in oscillatory motion about a given angle of attack, there is a phase lag between the variation of angle of attack, and the lift in time causing a hysteresis for the lift versus angle attack curve as shown in Fig. 3.9. This phase lag increases and the hysteresis curve becomes more pronounced by increasing as the frequency of oscillation gets larger. This shows us that the response of the airfoil to
|
ideal flow
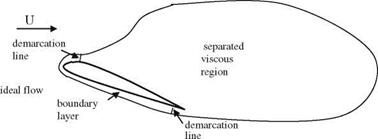
Fig. 8.4 Flow regions around an airfoil at high angle of attack |
the angle of attack change is delayed more and more with increasing unsteadiness. This means, while pitching, although the angle of attack can exceed the critical static stall angle the flow may still remain attached. In case of separation, depending on the size and the location of the bubble, as the lift curve returns back from its maximum, the curve deviates from its normal hysteresis behavior until the bubble reattaches itself. The studies related to this behavior were first seen in 1950s during the experiments performed on the helicopter blades in forced pitch oscillation in forward flight (Halfman et al. 1951; Rainey 1957). In later years, a detailed study by Litva gives the following detailed information on a special profile: (a) The effect of Mach number on aerodynamic damping, (b) the negative damping in large amplitude vertical oscillations, and (c) The maximum normal force is reported to be significant compared to static case. The wind tunnel used by Litva in his experimental studies had the following operational properties: (a) 0.20.6 Mach number range, (b) 2.2-6.6 x 10⁶ Reynolds numbers, (c) pitching reduced frequency range 0.04-0.72, reduced frequency range for heaving-plunging 0.04-0.24, and (d) a = 0°-25° average angle of attack range. For an airfoil which had the 13° angle of attack for static separation and maximum normal force coefficient as CN = 1.3, in dynamic tests, on the other hand, pitching about quarter chord point with k = 0.062, M = 0.4 and a = 14.92° at 17° angle of attack, the maximum normal force coefficient was CN = 1.6 (Litva 1969). In Litva’s work on dynamic cases an interesting observation was made on the moment coefficient change which starts at 12° angle of attack before the start of lift loss! On the other hand, the increasing frequency delays both the lift loss and the sudden drop of the normal force while reduces the hysteresis effect. Increase in the Mach number affects both the static and dynamic surface pressure before and after the lift loss in such a way that of the 10-15% chord the pressure increase is more for the separated flow case. As a result of this, the flow at high subsonic speeds separates at the leading edge and reattaches afterwards; however, the separation occurring near the trailing edge is sustained. The difference between the leading edge separation and the trailing edge separation are given by Ericsson and Reding. The difference for the dynamic case lift increase is the 50% for the leading edge separation and just 15% for the trailing edge separation. The effect of Mach number on the separation is also observed together with the angle of attack increase (McCroskey 1982). In his work, McCroskey describes the trailing edge separation as ‘light stall’, and the leading edge separation as ‘deep stall’.
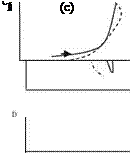
According to these definitions, the hysteresis curves for a typical airfoil pitching at small reduce frequencies in a low subsonic free stream are provided in Fig. 8.5. These graphs show the sectional lift CL, moment CM, and the drag coefficients CD changes with respect to angle of attack for one cycle of pitching. (a) At the onset of stall, CL preserves its elliptic shape accept near high angle of attack, CM changes in counterclockwise direction with increase in angle of attack, and CD increases slightly by increasing angle of attack. (b) In light stall, the lift coefficient has lost its elliptic character and as it reaches to its maximum value with a sudden drop it goes down by decreasing angle of attack, the moment coefficient behaves normal with increasing angle of attack, after its maximum with decreasing angle of attack
 |
 |
 |
Static case
Fig. 8.5 Dynamic stall: a on set of stall, b light stall, c deep stall it suddenly drops down, goes down in clockwise and climbs up in counterclockwise manner. The drag coefficient, on the other hand increases by increasing angle of attack to reach its maximum but with decrease in angle of attack the curve even goes down to very small negative region. (c) In the deep stall case, CL curve climbs up to its maximum value and with a sudden and deep drop goes down to its minimum value in clockwise manner, CM curve, before its maximum, first in clockwise then in counterclockwise manner completes its cycle, finally the drag coefficient CD takes quite a large value at the maximum angle of attack and with a sudden drop it goes back to its minimum value as it completes its cycle.
Let us examine the pitching moment change with angle of attack given by a close curve in one cycle. The value of this area, — j> CMda, gives us the amount of work, in non dimensional fashion, done on the flow by the profile in one cycle. If the value of the area is positive, then the profile does work on the flow, which reduces the energy of the profile. This has the damping effect on the profile motion. If the area under the — CM-a closed curve is negative then the flow
performs work on the profile to increase its energy, and that in turn increases the amplitude of the pitching oscillations. The increase in the amplitude of the oscillation caused by the negative damping creates the ‘flutter’. This type of flutter is called ‘stall flutter’. There is a close relation between the stall and the flutter. However, the main difference between the two is that the stall is a more general phenomenon, whereas the flutter is defined as the amplitude of oscillation increase caused by negative damping. (McCroskey 1982). There are some other conclusions that we can draw from Fig. 8.5b, c as follows: (b) in negative damping, the drag has a small propulsive effect because of being negative, and (c) in deep stall, the starting of loss in moment before the loss in lift occurs at the angle of attack at which static separation case loss also occurs.
In case of vertical oscillations, for the angles of attack less than the separation angle, the lift curve preserves its elliptic shape with the vertical coordinate h as indicated by the theory. For the angles of attack larger than the static separation angle, during the downstroke of the profile because of the separation, the lift loss takes its maximum value at the lowest position of the profile, and in upstroke of the airfoil because of reattachment the lift increases until it reaches the highest point (Litva 1969). Here, the area under the close curve of the lift coefficient, ^ CLdh, at a moderate Mach number, M = 0.4 and at a low reduced frequency k = 0.068 yields negative damping in one cycle. In this cycle, the moment coefficient change is about -0.1. The earlier experiments conducted did not report any negative damping (Halfman et al. 1951; Rainey 1957). The reason for this is because Litva has worked at higher Mach numbers and at higher amplitudes. A further increase in the Mach number reduces the negative damping eventually to zero because of creation of local shocks at critical Mach number of the profile.
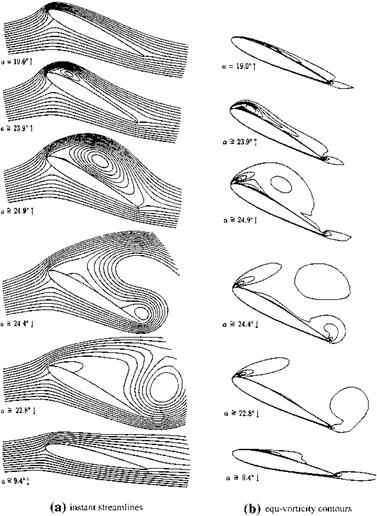
Although the dynamic stall phenomenon experiments and visualizations are helpful for obtaining useful empirical relations, see Problem 8.9 (Ericsson and Reding 1980), it seems more detailed and robust analyses are necessary for engineering applications (McCroskey 1982). The Computational Fluid Dynamics (CFD) as a tool gives this robust and detailed information with numerical solutions of Navier-Stokes equations. The pioneering work on the dynamic stall study of a pitching oscillation of NACA 0012 airfoil at Reynolds numbers of 5,000 and 10,000 with reduced frequencies of 0.50 and 0.25 was done by Mehta (1977). The agreement with the experimental work of Werle and the work of Mehta was the early indicative, in those years, of the success of CFD as an analysis tool. The aforementioned work required extensive computational time for one cycle of computations, therefore, especially for the flows with high Reynolds number and the turbulent flows necessitated faster and more efficient codes to reduce the computation times to reasonable levels by means of zonal methods described before (Wu et al. 1984). The integro-differential method developed by Wu and Gulgat, is implemented by Tuncer et al. (1990) for the dynamic stall analysis of NACA 0012 airfoil at Reynolds number of 106 at various reduced frequencies to compare with the experimental work (McCroskey 1981). As a turbulence model Baldwin-Lomax model which is applicable for separated flows also, is implemented. The numerical solution of the Navier-Stokes equations, Eq. 8.2, together with Eq. 8.9 was performed in moving coordinates using the effective viscosity. The angle of attack changed as a(t) = amin + (amax — amin)(1 – cos xt)/2. Shown in Fig. 8.6a is the instantaneous streamlines for k = 0.15, and amin = 5°, amax = 25°, for pitch oscillations of the airfoil. Before the oscillation is started at t = 0, the steady state solution is obtained for a 5° angle of attack. During upstroke, although the static stall angle is exceeded up to angle of attack being 20° flow does not separate. After 20°, however, flow separation starts from the trailing
|
Fig. 8.6 A cycle of pitching motion at Re = 106, k = 0.15. ‘‘Reprinted with permission of the American Institute of Aeronautics and Astronautics’’ |
edge and moves toward the leading edge and it reaches to leading edge at 23°. At about 23.9°, at quarter chord a leading edge vortex is formed and it covers the entire upper surface at 24.9°. Going back from the maximum angle of attack of 25°, the vortex leaves the airfoil surface, and moves downstream with a speed of
0. 3 U?, whereas the experimental value of this speed ranges in. 0.35-0.40 U?. During downstroke, the vortex starts to separate from the leading edge at 22.8° angle of attack, and with decreasing angle of attack the flow starts to reattach to upper surface similar to that of potential flow until the minimum angle of attack is reached.
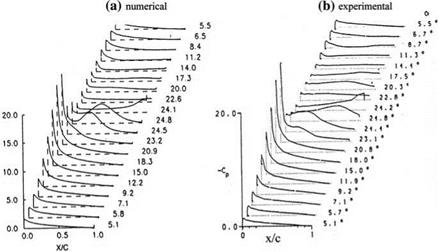
Shown in Fig. 8.7a, b are the numerical and experimental values of upper surface pressure coefficient variations during the upstroke and the downstroke motion of the airfoil. As the angle of attack increases, the suction effect of the leading edge vortex and the pressure increase after the separation of vortex from the surface are easily seen, and during the downstroke the flow reattaches, but because of thick boundary layer formation only at the minimum angle of attack the potential surface pressure distribution can be reached, Fig. 8.7.
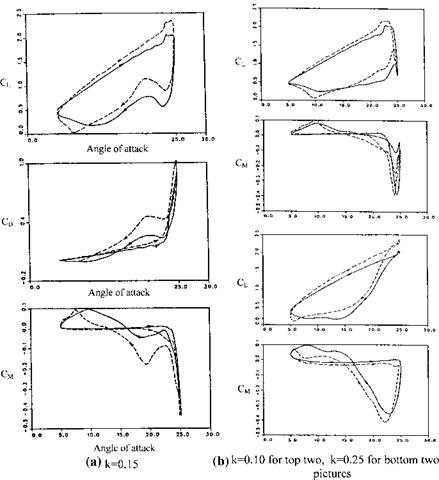
In Fig. 8.8a shown are the numerical and experimental (a) lift, (b) drag, and (c) moment coefficient plots for the same airfoil at k = 0.15 for one cycle of motion at which both experimental and numerical results show the same trend. (a) The lift increases with the increase of angle of attack until reaching maximum, and as the angle of attack becomes smaller the vortex separating from the surface causes lift to drop suddenly. At 22° angle of attack, the new surface vortex forms to increase the lift, however, because of the thick boundary layer formation the lift still drops down until 9° angle of attack and it takes its potential value when the angle of attack becomes minimum. (b) The drag coefficient, on the other hand, increases
|
Fig. 8.7 Upper surface pressure coefficient distribution a numerical, b experimental. ‘‘Reprinted with permission of the American Institute of Aeronautics and Astronautics’’ |
|
Fig. 8.8 Lift, drag and moment coefficients at Re = 106 for various reduced frequencies ‘‘Reprinted with permission of the American Institute of Aeronautics and Astronautics’’ |
with increasing angle of attack, after the static separation angle it gradually increases until 23° at which there is a sharp increase to CD = 1.0′ at a = 25°. During downstroke, the drag drops down to values even lower than the values attained at angles of attack equal to that of at upstroke angles, and finally it reaches 0.0 at minimum angle of attack. It is interesting to note that the drag becomes slightly negative when a 10° during the downstroke, which indicates that there is a slight propulsive force. (b) The moment coefficient stays at its zero value as the angle of attack increases until the leading edge suction occurs. Afterwards, the moment becomes negative because of growth of the vortex and its streamwise movement which makes CM = -0.6. Returning from maximum angle of attack, moment increases gradually as the angle is in 23°-19° range it decreases again but then it starts to increase to its maximum value of 0.1, and decreases to 0. The moment coefficient is in agreement with the experimental results. However, the area under the — CM-a curve gives a negative value, larger in magnitude than the value obtained numerically, for the experimental measurements, meaning that the flutter is reached before that predicted numerically.
In Fig. 8.8b shown are the lift and moment coefficient variations with respect to angle of attack in pitching with k = 0.10 and k = 0.25. For all three reduced frequencies the lift coefficient curves show similar behavior; however the moment coefficients have a tendency to give negative damping with increasing reduced frequencies.
The detailed CFD analysis of the dynamic stall phenomenon has been given here. In Leishman, however, extensive summary of empirical models introduced earlier are given. In addition, the effect of sweep on dynamic stall of a wing is studied with 30° angle of sweep at M = 0.4 free stream Mach number (Leishman). In his study Leishman observed that the lift curve slope is not affected with sweep; however, the separation angle increases about 4°, and during the downstroke the hysteresis curve gets narrower. In the moment diagram, the moment becomes more positive with sweep and the area under the hysteresis curve tends to give more negative damping.
In small sweeps for a finite wing the measurements made at k = 0.1 and M = 0.2 as the sweep increases:
1. lift curve slope decreases,
2. static separation angle of attack increases,
3. the lift curve hysteresis gets narrower,
4. the angle of attack at which the moment loss occurs is getting bigger.
A considerably more simple way of studying unsteady airloads at high angles of attack is possible via state-space representation of aerodynamic characteristics based on an input state variable (Goman and Khrabrov 1994). The sectional lift and moment coefficients of an airfoil undergoing an arbitrary unsteady motion can accurately be determined using the static tests separation point movement prescribed as an input state variable (see Problem 8.13).
At large sweep angles the separation phenomenon has a different character than the things happening at small sweeps. Let us next study what happens at high sweeps as the flow separates from the leading edges which may be sharp or round.


