Hover Performance
Reference 1 is an excellent collection of papers on the subject of ground – effect machines. Reference 2, taken from Ref. 1, forms the basis for most of the material presented in this section. This reference aptly illustrates what can be accomplished by the application of basic momentum principles, for its results agree closely with more sophisticated and elaborate analysis.
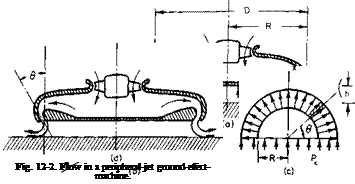
Initially, many investigators considered the two-dimensional GEM in order to provide insight into the behavior of all GEM’s. However, the analysis of Ref. 2 is sufficiently straightforward to permit the ready analysis of three-dimensional configurations. Consider first the performance of the circular planform, peripheral jet GEM shown in Fig. 12-2.
A control volume, shown in Fig. 12-26, is formed by a vertical plane of symmetry, the ground, the base of the machine, and the jet sheet. If pc is the pressure within the cavity above atmospheric pressure and it is assumed to be constant, the integral of this pressure taken over the plane of symmetry must equal the change in flux of momentum in the jet in the x-direction. If Fj is the total momentum in the jet, then
[p-dA =J„
![]() (12-1)
(12-1)
If the jet is assumed to curve in a circular path becoming tangent to the ground, the left-hand side of (12-1) becomes
J Pc dA = p^lRh + h2(l – 0 •
Therefore
![]() 2FJ
2FJ
Pc nD2[2(h/D) + (h/D)2(4 – 7t)]
Now, by applying the momentum theorem to control surfaces just above
and below the machine and neglecting the incoming momentum of the air, the weight that the jet system in ground effect can support is obviously
nD2
W = Fj + Pe—- (12-3)
Out of ground effect, W = = Fy The ratio of W to Wx is referred to
as the thrust augmentation factor A and from (12-2) and (12-3) becomes
![]()
 |
A = 1 +
The same procedure can be followed for other cases than that in which
the jet issues vertically downward. It can be advantageous to incline the jets inward through some angle в, as shown in Fig. 12-2d. However, there is little to be gained in going through the algebraic exercise of deriving A for the general case. Instead, the augmentation
![Hover Performance Подпись: Fig. 12-3. Thrust augmentation ratio versus height-diameter ratio: theory [Eq. (12-5)]; □ = unpublished data, 0 = 0°.](/img/3130/image944_4.gif) |
Equation (12-5) is presented graphically in Fig. 12-3 with some unpublished data for the particular case of в = 0. Although not too obvious
from the illustration, the optimum в for maximum A increases as A/D decreases. As A/D approaches zero, the optimum в approaches 90°. The nearly constant experimental values of A between A/D-values of 0.25 to 0.5 are typical of other experimental results.
Next consider the power required by a peripheral jet GEM to hover. If t is the thickness of the jet and Vj, the jet velocity, the power delivered to the jet is
P = QAp = (nDtv j)pv2j.
The actual power required will depend on the losses in the internal ducting and the efficiency of the fan. If they are combined into a single efficiency, /7, then the required horsepower can be expressed as
![]() The total flux of jet momentum F ■ can be written as Fj = nDtpVj.
The total flux of jet momentum F ■ can be written as Fj = nDtpVj.
The total lift of the machine W is thus AFj or W = AnDtpvj.
Hence the lift per horsepower is
W _ ПЩА
hp “ Vj
where W/S is the weight loading with S equal to nD2/4. Hence all other factors being equal the power loading increases inversely with the square root of the weight loading. In Chapter 4 the identical result was obtained for a propeller operating at zero forward speed. From Eq. (4-16) for a propeller
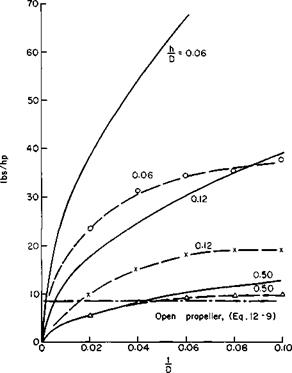
These power and thrust relationsmps can be expected to hold only where the thickness of the jet is small in comparison with the height and diameter. Generally speaking, the predictions are optimistic in comparison with experimental data, at least as far as the power is concerned. Figure 12-4 compares model data taken from Ref. 3 with calculations based on Eqs. (12-4) and (12-8) from which the experimental values of pounds per horsepower for h/D values of 0.12 and 0.06 are seen to be significantly lower than the theory would predict. The experimental values, however, are still well above the value of pounds per horsepower for the ideal statically thrusting propeller with a disk loading of 20 psf.
Figure 12-5 presents the results of calculations based on Eqs. (12-5) and (12-8) for a range of h/D-, в-, and W/S-values for a constant value of t/D of 0.08. The selection of the combination of these design parameters depends on other factors in addition to the aerodynamics. For example, the mini
mum value of h that can be tolerated will depend on the maximum obstacle height one wishes to pass over. From a power standpoint, of course, the lower the h and W/S the better. Generalized design studies tend to indicate that the place of the GEM in future transportation will probably be as large, high-speed ocean-going craft.
|
Fig. 12-4. Lifting capability of GEM’s:————— experimental (Ref. 3), ———- theory [Eq. (12-8)]; W/S = 20 psf; hp = jet horsepower. |
Presently, machines are operating commercially with gross weights of approximately 30 tons up to speeds of 80 mph with an installed horsepower of 4000. Larger machines up to 100 tons with speeds of 120 knots and power of 10,000 hp are currently in the design stage. The weight loadings of these machines are fairly low at about 10 psf of base area. The power loadings are approximately 16 to 20 lb/hp—nearly double that of helicopters.


