Induced Power
The rotor obeys the same momentum equations as the wing. The equation for the induced drag of the ideal rotor in forward flight can be written by analogy to the wing:
|
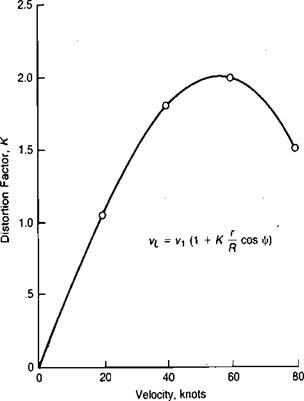
FIGURE 3.5 Induced Velocity Distortion Factor at Low Airspeeds |
Source: Ruddell, “Advancing Blade Concept (ABC) Development,” JAHS 22-1, 1977
The corresponding induced power is:
h – D™V – Г P’ind 550 l,100p AV
Note that, for a constant rotor thrust, the induced power decreases as forward speed increases. This is a consequence of the rotor handling more air per second and having to accelerate it downward less to achieve the same thrust.
The derivation so far has been based on an ideal rotor, analogous to an ideal wing with an elliptical lift distribution. The airplane aerodynamicist accounts for the fact that a wing seldom has an elliptical lift distribution by using an Oswald efficiency factor, e, in the denominator of the induced drag equation:
ind їїА. К.е
where e is less than unity. For a rotor, a corresponding rotor efficiency factor can be evaluated by comparing the distribution of circulation in the wake with an ideal
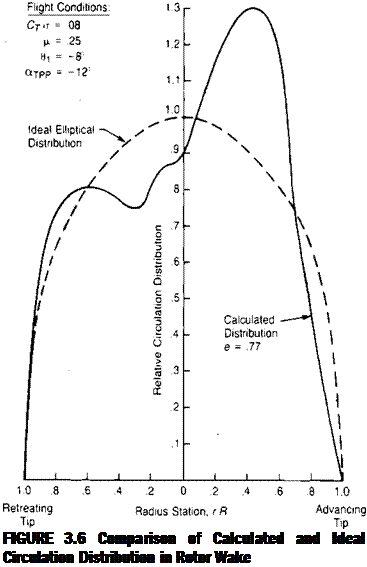
elliptical distribution. This was done in reference 3.7, in which the circulation distribution in the wake of an infinite-bladed rotor was computed from a blade element method assuming an uniform induced velocity distribution at the rotor. Figure 3.6 shows the computed distribution of circulation for a specific flight condition and the value of e that corresponds to this distribution. Figure 3.7 shows the results of the evaluation in rerms of e as a function of the angle of attack of the tip path plane for several values of tip speed ratio, Cr/’o, and twist. The angle of attack of the tip path plane for use in this type of analysis can be approximated by:
![]() D
D
aTPP = -57.3————–
 |
TPP G. W
computed, and the increments of induced drag due to these velocities are integrated to give the total rotor-induced drag. This type of analysis, of course, is more accurate but also more work. Reference 3.8 gives the results for only one point corresponding to a two-bladed UH-1 helicopter with —12° of twist at a tip speed ratio of.26, a Ct/g of 0.09, and a rotor angle of attack of about —9°. The value of e calculated by this method is 0.26 compared to 0.75 interpolated from Figure 3.7. Some, if not all, of the difference may be due to the difference in the number of blades used in the two analyses. Further calculations of this type should lead to a better understanding of the effects of different numbers of blades.
The equation for the induced power is:
or, alternatively:
Since most performance calculations are done with a blade element approach, the use of the rotor efficiency factor is limited. It does, however, provide some insight into what portion of the total power is induced power and how this portion is affected by flight conditions. It can also be used in the analysis of flight and wind tunnel test data, where it is desired to divide the total power into its various components.
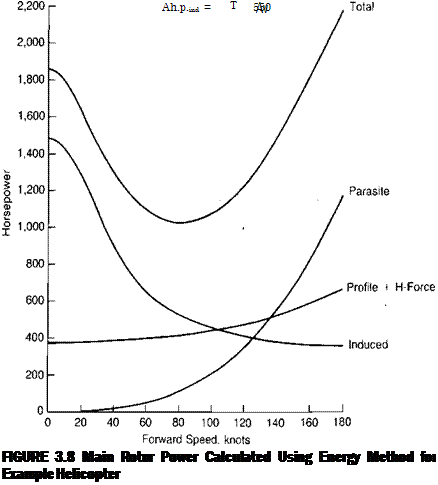
The calculated induced power for the example helicopter using the efficiency factor of Figure 3.7 is shown in Figure 3.8 as a function of forward speed.
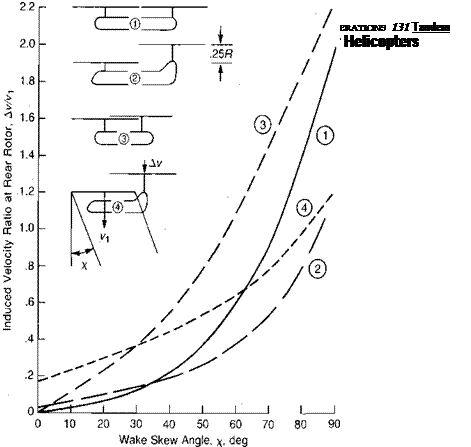
The rotors of a tandem rotor helicopter cannot be treated as two independent rotors since they aerodynamically interfere with each other. The effect is primarily one of the rear rotor operating in a "climb” condition, due to the downwash of the front rotor. The induced velocity at the rear rotor due to the front rotor can be estimated using theoretical charts such as those presented in reference 3-9. Figure 3.9 summarizes the results for several relative rotor positions as the ratio of induced velocity at the rear rotor to the induced velocity at the front rotor, kv/vx as a function of the wake skew angle, x, where:
V
x — tan —
 |
(л – = 0 in hover and approaches 90° in high-speed flight.) The increase in power is:
where T is the thrust of one rotor.
For side-by-side configurations, the streamtube has the same diameter as the total span of the rotors, and thus the induced velocity corresponding to a given thrust is less than on a single rotor. The same consideration applies to a tandem rotor helicopter in sidewards flight, and, as a matter of fact, tandems are flown sideways at low speeds when maximum takeoff performance is desired.
The power required to overcome the drag of all the nonrotor components is known as the parasite power, h. p.A
![]()
 |
550
The parasite drag could be expressed as a function of a drag coefficient as it is in airplanes:
Dp = CDqS
but in the case of a helicopter without a wing, the assignment of a reference area, S, is not a straightforward procedure. For instance, using the rotor disc area as a
![]()
|
|||
|
|||
|
|||
|
|||
|
|
||
|
|||
|
|||
|
|||
|
|||
|
|||
|


