Numerical Study of the Influence of Geometrical Uncertainties (Testcase SFB-401)
The influence of geometrical uncertainties on flow parameters is investigated considering the 3d testcase SFB-401 (Navier-Stokes flow). A detailed overview and introduction to uncertainty quantification methods can be found in [42], [35], [24]. We will concentrate in the following on a Polynomial Chaos approach which expands the solution nonlinearly depending on the random variable з or random vector respectively, in a series of orthogonal polynomials with respect to the distribution of the random input vector
f (У,P, s(O) = X aі(У’P) ■ ф(s(Z)) (76)
i=1
with Фі orthogonal polynomials, ai(y, p) deterministic coefficient functions. For a detailed discussion of the method, we refer to [41]. The basic idea of Polynomial Chaos representing the stochastic output of a differential equation with random input data is to reformulate the SDE replacing the solution and the right hand side of the PDE by a Polynomial Chaos expansion. Given a stochastic differential equation of the form
L(x, t,Z;u)= g(x, t, Z), X e G, t Є [0, T], Z e a (77)
where u = u(x, t, Z) is the solution and g(x, t, Z) is the right hand side. The operator L can be nonlinear and appropriate initial and boundary conditions are assumed. Replacing pointwise the solution u = u(x, t, Z) of equation (77) by the Polynomial Chaos expansion leads to
M
u(x, t, Z) = X uk(x, t)Фк(s(Z)) (78)
k=1
where uk(x, t) are the deterministic Polynomial Chaos coefficients which need to be determined. Furthermore, the right hand side g(x, t, Z) will be also expanded by a Polynomial Chaos expansion
M
![]()
![]() g(xt, Z) = X gk(x>t)фк(3(Z))
g(xt, Z) = X gk(x>t)фк(3(Z))
k=1
and the deterministic coefficients are given by
< g(x, t, ■)ф >
< ф2к >
In the literature, two different classes of methods determining the unknown coefficients uk(x, t) are proposed: non-intrusive and intrusive Polynomial Chaos. As the intrusive methods require a modification of the existing code solving the deterministic PDE (if the Operator L is nonlinear), this drawback of the method force us
 |
to consider non-intrusive Polynomial Chaos methods which allow to use the flow solver as a black-box. The unknown coefficients are given by
whereas the integral of equation (82) is approximated by a sparse grid approach.
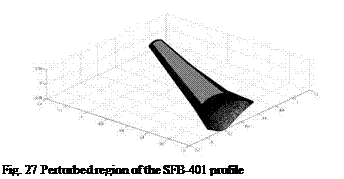 |
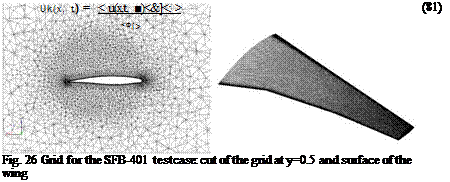
In the 3d testcase, the space is discretized by 2506637 grid points, where the surface is described by 80903 points. The grid generated with Centaur consists of 1636589 tetraeders, 4363281 prisms and 170706 surfacetriangles, 5427 surfacequadrilaterals, see Fig. 26. The geometrical uncertainties are assumed to occur on the upper side of the wing, the perturbed region is depicted in Fig. 27. The perturbations are modeled as a Gaussian random field with the following second order statistics
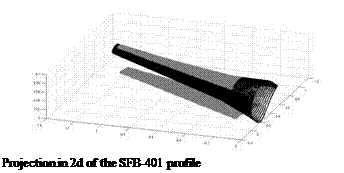 |
Fig. 28
E (y(x, Z)) = 0 Vx Є Г (83)
Cov(x, y) = (0.0016)2 – exp Vx, y Є Г. (84)
In order to take the curvature of the wing into account computing the norm in (84), the selected area is transformed into 2d approximating the distance by a polygon path on the surface. The projection is depicted in Fig. 28 Due to the problem size, an iterative eigensolver BLOPEX (cf. [28]) is used in order to solve the eigenvalue problem arising from the Karhunen-Loeve expansion. The resulting eigenvalue distribution of the first 50 eigenvalues is shown in Fig. 29.
We consider the first 15 eigenvalues and eigenvectors to represent the random field, as an example the first, 8th and 15th eigenvectors and resulting perturbed shapes are depicted in Fig. 30.
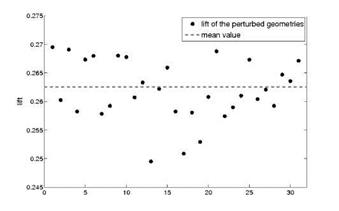
In order to approximate statistics of the flow solution depending on the considered perturbations, the drag, the lift and the pressure coefficient cp are expanded into the first 16 multidimensional Hermite polynomials. In the next two figures (Fig. 31, Fig. 32), the drag and the lift of each perturbed shape and the corresponding
x 10 1
0 5 10 15 20 25 30 35 4 0 45 50
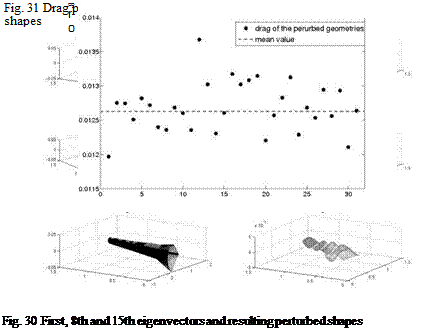
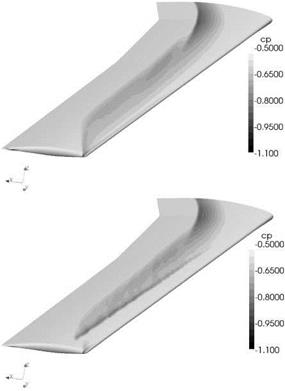
mean values are illustrated. As Fig. 31 indicates, the geometry uncertainties have a large impact on the target functional. The standard deviation from the mean value is equal to 1.65 drag counts, and the mean value is 6.55 drag counts higher than the nominal, unperturbed geometry. The comparison between the Cp distribution of the unperturbed geometry and the Cp distribution of the mean value shows that an
|
Fig. 32 Lift performance and mean value of the perturbed 3d shapes |
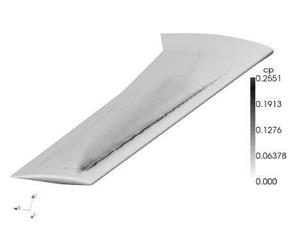
additional shock on the upper side of the shape occurs due to the uncertainties in the geometry (cf. Fig. 34). Fig. 33 emphasizes the influence of the perturbations showing the variance of the cp distribution.
8 Conclusions
Robust design is an important task to make aerodynamic shape optimization relevant for practical use. It is also highly challenging because the resulting optimiza-
|
|
|
Fig. 34 Comparison between the cp distribution of the unperturbed geometry (above) and the cp distribution of the mean value (below) |
tion tasks become much more complex than in the usual single set-point case. The comparison of the two robust optimization formulations shows that the discretized semi-infinite formulation seems to be of advantage in a numerical test case close to a real configuration. In the case of the geometric uncertainty, the approximation of the random field describing the perturbations of the geometry leads to a very high dimensional optimization task. The dimension of the probability space was efficiently reduced by a goal-oriented choice of the Karhunen-Loeve basis. Furthermore, adaptive Sparse Grid techniques and one-shot methods have been successfully generalized to the semi-infinite formulation of the shape optimization problem in order to reduce the amount of computational effort in the resulting robust optimization. The numerical results show that even small deviations from the planned geometry have
a significant effect on the drag and lift coefficient, so that geometry uncertainties have to be taken into account in the aerodynamic design optimization problem to ensure a robust solution. The introduced methods can significantly reduce the costs of the robust optimization, so that robust design becomes numerically tractable in the aerodynamical framework.
[1] See http://aaac. larc. nasa. gov/tsab/cfdlarc/aiaa-dpw
[2]-2 10-1 10° 101 102
reduced frequency, ©
Fig. 16 Fourier-transformed fluctuations of lift coefficient Cl and corresponding fluctuations over time for an LES simulation
Volker Schulz • Claudia Schillings
FB IV Department of Mathematics, University of Trier, Universitatsring 15,
54296 Trier, Germany
e-mail: {volker. schulz, claudia. schillings}@uni-trier. de
[4] MEGADESIGN Aerodynamic simulation and optimization in aircraft design, German national project funded by the German Federal Ministry of Economics and Labour (BMWA).
B. Eisfeld et al. (Eds.): Management & Minimisation of Uncert. & Errors, NNFM 122, pp. 297-338. DOI: 10.1007/978-3-642-36185-2_13 © Springer-Verlag Berlin Heidelberg 2013


