Re = 103-104
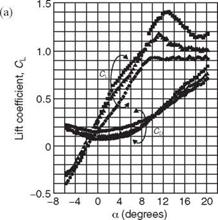
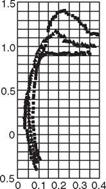
Okamoto et al. [139] experimentally studied the effects of wing camber on wing performance with Reynolds numbers as low as 103 to 104. Their experiment used rectangular wings with an AR of 6, constructed from aluminum foil or balsa wood. Figure 2.12 illustrates the effects of camber on the aerodynamic characteristics. As the camber increases, the lift coefficient slope and the maximum lift coefficient increase as well. The increase in camber pushes both the maximum lift coefficient and maximum lift-to-drag ratio to a higher AoA. More interestingly, the 3 percent camber airfoil shows a stall-resisting tendency, with the lift just leveling off above an AoA of 10°. Although it has the disadvantage of a high drag coefficient, the low-camber airfoil is less sensitive to the AoA and therefore does not require sophisticated steering.
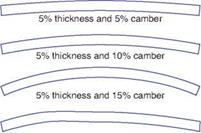
Sunada et al. [140] compared wing characteristics at the Reynolds number of 4 x 10³ using fabricated rectangular wings with an AR of 7.25; representative wings are shown in Figure 2.13. After testing 20 wings, they concluded that the wing
Figure 2.12. Effects of circular camber on the aerodynamic characteristics of a rectangular model wing made from aluminum foil, thickness 0.3 mm and chord length 30 mm. Each symbol refers to a different camber, as shown in the panel on the right side of the figure. (a) CL and CD against the AoA; (b) polar curve. From Okamoto et al. [139].
![]()
![]()
![]()
![]()
![]()
![]()
![]()
![]()
![]()
![]()
![]()
![]()
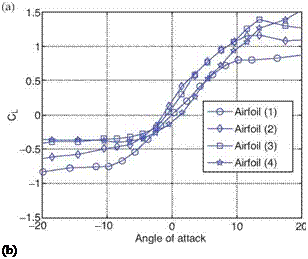
![]() performance can be improved with a modest camber of around 5 percent. Figure 2.14 shows the lift and drag coefficients against the AoA. At the Reynolds number, Re = 4 x 10³, the effect of camber on aerodynamics found by Sunada and colleagues is similar to that reported by Okamoto et al. [139]. In both experiments, the lift – curve slope increases with the camber; a higher camber wing has a higher stall AoA and generally a larger drag coefficient than a lower camber wing at the same AoA. If we further compare wings of comparable cambers, we notice that they have almost the same stall angle. Sunada et al. [140] also investigated the impact of maximum-camber location, as shown in Figure 2.15. They found that both lift and drag coefficients increase as the position of the maximum camber approaches the trailing edge. In terms of lift-to-drag ratio, the maximum value is obtained when the maximum camber is positioned at 25 percent chord.
performance can be improved with a modest camber of around 5 percent. Figure 2.14 shows the lift and drag coefficients against the AoA. At the Reynolds number, Re = 4 x 10³, the effect of camber on aerodynamics found by Sunada and colleagues is similar to that reported by Okamoto et al. [139]. In both experiments, the lift – curve slope increases with the camber; a higher camber wing has a higher stall AoA and generally a larger drag coefficient than a lower camber wing at the same AoA. If we further compare wings of comparable cambers, we notice that they have almost the same stall angle. Sunada et al. [140] also investigated the impact of maximum-camber location, as shown in Figure 2.15. They found that both lift and drag coefficients increase as the position of the maximum camber approaches the trailing edge. In terms of lift-to-drag ratio, the maximum value is obtained when the maximum camber is positioned at 25 percent chord.
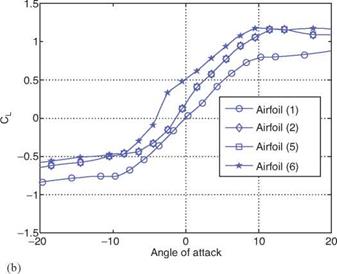
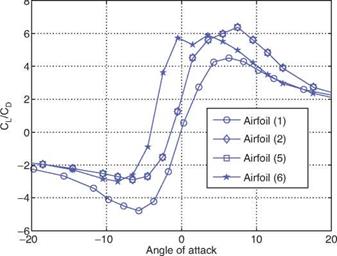
Okamoto et al. [139] also studied the effects of airfoil thickness. They found that the wing’s aerodynamic characteristics deteriorate as its thickness increases (see Fig. 2.16). In contrast to conventional airfoils, which are smooth and streamlined, insect airfoils exhibit rough surfaces; for example, the cross-sectional corrugations of dragonfly wings (shown in Fig. 217c) or scales on the wing surface (butterfly and moth). Evidence has shown that the corrugated wing configuration confers both structural and aerodynamic benefits to the dragonflies. First, it is of critical
![]()
|
|
|
|
|
|
|
|
![]()
![]()
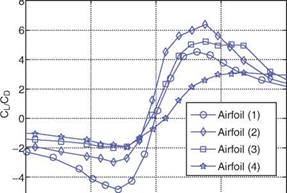 Figure 2.14. The effect of maximum camber location on the aerodynamic characteristics at the Reynolds number, Re = 4 x 10³. Redrawn from Sunada et al. [140] with permission.
|
|||
|
|
||
|
|
|
Figure 2.15. The effect of maximum camber location on the aerodynamic characteristics at the Reynolds number, Re = 4 x 10³. Redrawn from Sunada et al. [140] with permission. |
importance to the stability of the wing’s ultralight construction. Second, in visualizing experiments using corrugated wings, Newman and Low [141] and Buckholz [142] showed that this geometry helps improve aerodynamic performance. The reason, as suggested by Kesel, is that vortices fill the profile valleys formed by these bends and therefore smooth the profile geometry [143].
Kesel [144] compared the aerodynamic characteristics of dragonfly wing sections with conventionally designed airfoils and flat plates at the Reynolds numbers of 7.88 x 10³ and 104. She concluded that corrugated airfoils, such as those seen in dragonflies (see Fig. 2.17), have very low drag coefficients closely resembling those of flat plates, whereas the lift coefficient is much higher than those of flat plates. She also investigated the performance of the airfoil by simply filling the valleys with solid
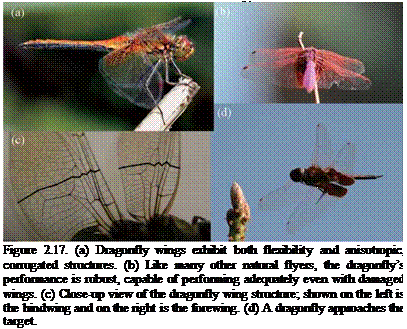 |
Figure 2.16. Effects of thickness on the aerodynamic characteristics of a curved-section model wing (camber 9%). Each symbol refers to a different airfoil shape as shown in the panel on the right; c, chord length; t, thickness; Re, Reynolds number. All dimensions are given in millimeters. (a) CL and CD against the AoA; (b) polar curve. From Okamoto et al. [139].
![Подпись: Figure 2.18. Geometry of wing profiles used in the study of Kesel [144]. Profiles 1, 2, and 3 are constructed using measurement taken from a dragonfly wing. Profiles 1A, 2A, and 3A are built by connecting the peaks of the respective cross-sections.](/img/3131/image137_2.gif) |
materials (as illustrated in Fig. 2.18). Figure 2.19 highlights the key features of the lift and drag values against AoAs between the three natural and filled airfoil profiles. Figure 2.20 shows the corresponding lift-drag polar. These plots, taken from Kesel [144], show that the filled airfoils have less favorable aerodynamic performances. Therefore it is clear that the performance of such corrugated airfoils is influenced by their “effective” shape, which is characterized by the viscous effects, as previously discussed. In particular, the viscosity and associated vortical structures result in an airfoil with cambered geometry [144].
Vargas et al. [145] numerically investigated the effects of the pleats on the aerodynamic performance at Re = 102-104 with the range of AoA from 0° to 10°. The pleats’ effect on the flow is most evident at low AoAs where the flow is basically attached to both surfaces of the wing section. At those AoAs, although the pleated airfoil experiences an increase in the pressure drag, this increase is more than offset by a concomitant decrease in the shear drag. The reduction in the shear drag occurs because there are recirculation zones inside the cavities formed by the pleats, which lead to a negative shear drag contribution (see Fig. 2.21). Also noted by Vargas et al. [145] is that, beyond the Reynolds number of 5.0 x 10³ and an AoA of 5°, the pleated airfoil performs better than the flat plate and the profiled airfoil. Kim et al. [146] also numerically investigated the aerodynamic performance of the dragonfly wing at Re = 1.5 x 102,1.4 x 103, and 105 with an AoA ranging from 0 to 40°. Their
due to the viscous effects of the flow around the wing, the original airfoil shape behaves effectively like a smooth envelope contour resembling a conventional airplane airfoil. Of course, for dragonfly, this explanation is incomplete because the unsteady fluid physics associated with the flapping motion and deformable wing shapes and the interactions between fore – and hindwings interplay with significant effects.


