Static Stall
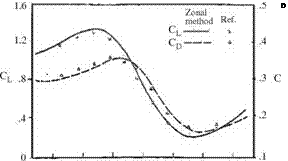
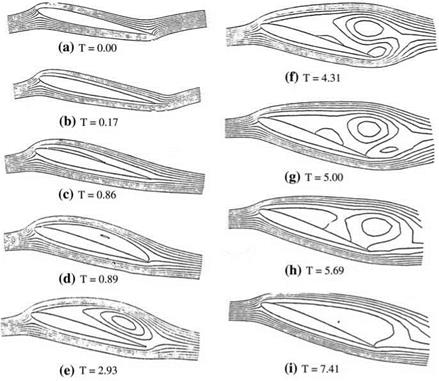
The books on classical aerodynamics depict the picture of static stall as the sudden lift lost after a critical angle of attack. The aerodynamic aspects after the static stall are not usually emphasized (Abbott and Von Doenhoff 1959). However, even in early 1930s there were some experimental studies performed on different profiles to predict their lifting characteristics beyond stall (Eastman, Anderson). On the other hand, in later years both improvement in visualization and measurement techniques, and numerical solutions of Navier-Stokes equations in advanced computational means and tools enable researchers to study flow separation and corresponding lift lost at least with laminar flow studies (Mehta 1972). The whole flow field was solved by finite difference in Mehtas’ study which required very large computer memory and time in those days. In addition, solving the attached and separated flow regions with full Navier-Stokes solver caused extra numerical errors. This type of errors and computational time were reduced by means of an integro-differential method (Gulcat 1981, 2009a, b Wu and Gulcat 1981). The integro-differential method reduces the computational time with increasing Reynolds number (Wu et al. 1984). Now, we can step by step show the solution domain obtained by integro-differential method for one cycle of flow features by means of instantaneous streamlines of the separated flow past 9% thick Joukowsky airfoil at 15° angle of attack in Fig. 8.2a-j. The laminar flow is studied at Reynolds number of 1,000 with the initial conditions given at t = 0 as the non circulatory potential flow solution whose streamlines are shown in Fig. 8.2a. Here the non dimensional time is given by the free stream speed and the chord length of airfoil. After the impulsive start, for a short time the flow continues without separation as shown in (b), and as seen in (c) near the leading edge a separation bubble appears. This bubble grows larger to become the main bubble as shown in (d), and forms a large clockwise vortex covering almost the entire upper surface. The main bubble afterwards bursts and separates from the upper surface as shown in (f). The separation of the main vortex from the surface and its movement towards the wake with the main stream generates a counterclockwise rotating vortex at the trailing edge and a secondary weak bubble at the upper surface (f, g). While the secondary surface bubble grows as shown in (g), the trailing edge vortex detaches from the trailing edge and gets carried into the wake (g, h). Meanwhile, recently generated leading edge separation bubble spreads over the entire upper surface in place of the weakening and bursting secondary bubble (h). Thus, one cycle of events becomes complete, starting at t = 1.89, and ending at time t = 7.41 to have the non dimensional period of T = 5.52. The Strouhal number for this flow hence becomes 0.18. The flow separation and one period of vortex formation appear to be unsteady although the boundary conditions of the flow remain the same. Now, we can observe the time variation of the lift and the drag coefficient by examining Fig. 8.3. Impulsively started airfoil at t = 0+ has no circulation and therefore, it has zero lift but very large drag. For this reason, Fig. 8.3 shows the lift and the drag curves together which are started for t > 0 just before the flow separation.
|
 |
|
The lift coefficient CL reaches its maximum value when the separation bubble covers the entire upper surface at t = 1.89. This means the suction created by the separation bubble generates additional lift. However, after the bursting of the main separation bubble, the lift coefficient drops down from 1.3 to its minimum value
0.2 in the time interval t = 2.93 to t = 5.69. After reaching its minimum value, the lift coefficient increases slightly as the new separation bubble grows and covers the upper surface eventually.
The drag coefficient, given in Fig. 8.3, changes by time similar to the lift coefficient with a phase difference. Since the Reynolds number is low, the drag coefficient values are higher than usual. The drag coefficient takes its maximum value 0.35 when the main separation bubble covers the upper surface causing the largest suction force normal to surface whose streamwise component is quite high. After the bursting of the main bubble, the drag value drops down to its minimum value of 0.15. The growth of new leading edge bubble causes suction to increase, and this in turn makes drag grow to 0.2. As shown in Fig. 8.3, the results of the zonal method is in agreement with the results of the full Navier-Stokes solver given as reference (El-Refaee 1981).
The flow separation causing static stall is a strong separation from the upper surface under constant high angle of attack. The analysis of separated flow regions is possible with numerical solution of Navier-Stokes equations. At the lower surface of the airfoil boundary layer is formed because of favorable pressure gradient. This enables us to divide the entire flow region into two different regions with different flow features, that is attached and detached flow regions which are connected to each other. In the attached flow the boundary layer equation is solved, and Navier-Stokes equations are employed in detached region to give fast and accurate results. These two different regions are interlaced with an integral approach, and the conditions at infinity are satisfied while computing the vortex sheet strength on the surface of airfoil. For this purpose let us express the governing equations in velocity-vorticity formulation in two dimensions. The definition of vorticity: x = V x V from the velocity field V gives us the continuity and the momentum equations as follows:
![]()
![]() VxV = 0
VxV = 0
and,
0Ю ~
= — (V xV)x + vV2x.
The boundary layer approximation gives the relation between the vorticity and the velocity component vs parallel to surface as follows,
Here, n is the normal direction to surface, and
![]() (8.5)
(8.5)
At a station along the boundary layer, if we know the vorticity value, then integration of Eq. 8.5 in the normal direction gives us the velocity component parallel to surface as follows
n
vs(s, n) = -^ x(s, n)dn. (8.6)
0
 |
||
Knowing vs component in two consecutive stations let us utilize the integral of continuity equation in normal direction to obtain
Equation 8.5 is solved to obtain the vorticity values at the new time level t by forward differencing in time, forward differencing in s and central differencing in y direction. This gives us a tri-diagonal system of equations for new time level vorticity values to be found at a given station (Wu and Gulcat 1981). As the boundary conditions of Eq. 8.5, the vorticity at the edge of the boundary layer is taken as zero, and the surface vortex sheet strength computed by integral approach is utilized as the surface boundary condition. We can make use of the continuity of vorticity to obtain an expression for the induced surface velocity by the velocity field at infinity and the vorticity field excluding the surface of the airfoil. This gives us the following integral relation
In Eq. 8.8, S+ is the neighborhood of the profile surface S, R is the vorticity field, rs is the point on the surface, ms is the vorticity value at the surface, and V(rs, t) is the time dependent surface velocity vector. Once the surface velocity and the free stream velocity are described, together with the known vorticity field from Eqs. 8.3 and 8.5 we can obtain the surface vortex sheet strength from Eq. 8.8. The kinematics of the separated flow region can be formulated in terms of the stream function W and the vorticity ю as follows
V2W = – ю. (8.9)
The kinetics of the separated flow on the other hand is given by Eq. 8.3. The simultaneous solution of Eqs. 8.3 and 8.9 with finite differencing gives vorticity and the velocity fields. The Integro-differential method applied to a flow past an airfoil at high angle of attack can handle the three different flow regions
simultaneously as shown in Fig. 8.4. These regions are (a) ideal flow region, (b) boundary layer region, and (c) the separated flow region.
The ideal flow region has zero vorticity; therefore, we only need to have the farfield boundary condition effective on the body as the contribution to the flow field from this region. The viscous region, on the other hand, induces velocity according to the Biot-Savart law. The induced velocity can be expressed as the vortex sheet strength on the airfoil surface with the aid of Eq. 8.8. After the impulsive start, the diffused vorticity covers a small flow region around the airfoil surface which is the agent that creates the vorticity. By time this vorticity is convected in the flow direction to increase the vorticity field. We initially take the computational domain small and enlarge it in parallel with the size of the vortex region. This enables us to keep the computational work minimum, and saves us from having spurious errors because of unnecessarily performed computations.
Studying the leading edge separation from certain profiles in two dimensions helps us to understand the nature of the suction generated by the vortex before it bursts. In three dimensional flows because of high sweep we can have the vortex to roll rather than to burst in sustaining the suction force to provide the extra lift at high angles of attack which may cause the 2-D profile to stall.
Now, we can study another stall phenomenon which is dynamic stall of pitching or plunging airfoils in periodic motion wherein the onset of leading edge flow separation is delayed in terms of angles of attack higher than the occurrence of static stall for the same airfoil.


